Estimated Value: $475,146 - $503,000
3
Beds
3
Baths
1,636
Sq Ft
$300/Sq Ft
Est. Value
About This Home
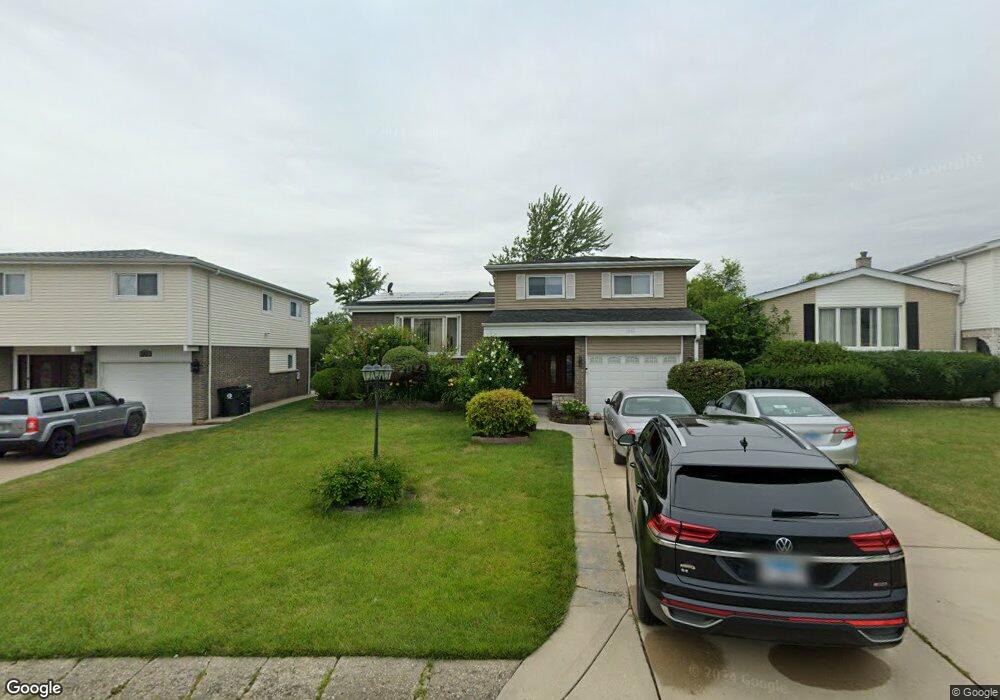
This home is located at 9858 N Robin Rd, Niles, IL 60714 and is currently estimated at $490,787, approximately $299 per square foot. 9858 N Robin Rd is a home located in Cook County with nearby schools including Washington Elementary School, Gemini Middle School, and Maine East High School.
Ownership History
Date
Name
Owned For
Owner Type
Purchase Details
Closed on
Apr 22, 2025
Sold by
Reme Wilkens and Reme Claudette
Bought by
Parkway Bank And Trust and Trust Number 17146
Current Estimated Value
Purchase Details
Closed on
Oct 22, 2004
Sold by
Lee Hak Soon and Lee Jung Sook
Bought by
Reme Wilkens and Reme Claudette
Home Financials for this Owner
Home Financials are based on the most recent Mortgage that was taken out on this home.
Original Mortgage
$285,000
Interest Rate
5.86%
Mortgage Type
Stand Alone First
Purchase Details
Closed on
Dec 28, 2001
Sold by
Lee Won Soon and Lee Young Sook
Bought by
Lee Hak Soon and Lee Jung Sook
Purchase Details
Closed on
Dec 26, 2001
Sold by
Lee Won Soon and Lee Young Sook
Bought by
Lee Won Soon and Lee Young Sook
Purchase Details
Closed on
May 5, 1998
Sold by
Sun Lee Kyung Chae and Sun Lee Young
Bought by
Lee Won Soon and Lee Yong Sook
Home Financials for this Owner
Home Financials are based on the most recent Mortgage that was taken out on this home.
Original Mortgage
$140,000
Interest Rate
7.25%
Create a Home Valuation Report for This Property
The Home Valuation Report is an in-depth analysis detailing your home's value as well as a comparison with similar homes in the area
Home Values in the Area
Average Home Value in this Area
Purchase History
| Date | Buyer | Sale Price | Title Company |
|---|---|---|---|
| Parkway Bank And Trust | -- | None Listed On Document | |
| Reme Wilkens | $360,000 | Pntn | |
| Lee Hak Soon | -- | -- | |
| Lee Won Soon | $275,000 | -- | |
| Lee Won Soon | $190,000 | -- |
Source: Public Records
Mortgage History
| Date | Status | Borrower | Loan Amount |
|---|---|---|---|
| Previous Owner | Reme Wilkens | $285,000 | |
| Previous Owner | Lee Won Soon | $140,000 |
Source: Public Records
Tax History Compared to Growth
Tax History
| Year | Tax Paid | Tax Assessment Tax Assessment Total Assessment is a certain percentage of the fair market value that is determined by local assessors to be the total taxable value of land and additions on the property. | Land | Improvement |
|---|---|---|---|---|
| 2024 | $8,410 | $35,240 | $6,757 | $28,483 |
| 2023 | $8,572 | $38,000 | $6,757 | $31,243 |
| 2022 | $8,572 | $38,000 | $6,757 | $31,243 |
| 2021 | $6,499 | $25,196 | $5,791 | $19,405 |
| 2020 | $6,209 | $25,196 | $5,791 | $19,405 |
| 2019 | $7,018 | $31,894 | $5,791 | $26,103 |
| 2018 | $7,450 | $30,696 | $4,987 | $25,709 |
| 2017 | $7,341 | $30,696 | $4,987 | $25,709 |
| 2016 | $7,071 | $30,696 | $4,987 | $25,709 |
| 2015 | $6,734 | $27,144 | $4,182 | $22,962 |
| 2014 | $6,515 | $27,144 | $4,182 | $22,962 |
| 2013 | $6,382 | $27,144 | $4,182 | $22,962 |
Source: Public Records
Map
Nearby Homes
- 9909 N Huber Ln
- 241 Glendale Rd
- 2815 Helen Dr
- 2740 Norma Ct
- 401 Greenwood Rd
- 2821 Covert Rd
- 521 Michael Manor
- 400 Glendale Rd
- 2700 Fontana Dr
- 329 Cherry Ct
- 8101 W Courte Dr Unit D203
- 8101 W Courte Dr Unit D307
- 203 Valerie Ct
- 608 Glenwood Ln
- 8100 W Foster Ln Unit C508
- 8663 Gregory Ln Unit 10
- 216 Flora Ave
- 616 Glendale Rd
- 3420 Greenbriar Dr
- 342 Cherry Ln
- 9866 N Robin Rd
- 9854 N Robin Rd
- 9905 N Wendy Way
- 9850 N Robin Rd
- 9868 N Robin Rd
- 9907 N Wendy Way
- 9915 N Wendy Way
- 9903 N Wendy Way
- 9841 N Glendale Ln
- 9923 N Wendy Way
- 9857 N Robin Rd
- 9842 N Robin Rd
- 9851 N Robin Rd
- 9901 N Wendy Way
- 9867 N Robin Rd
- 9837 N Glendale Ln
- 9841 N Robin Rd
- 9923 N Huber Ln
- 9927 N Huber Ln
- 9856 N Lauren Ln