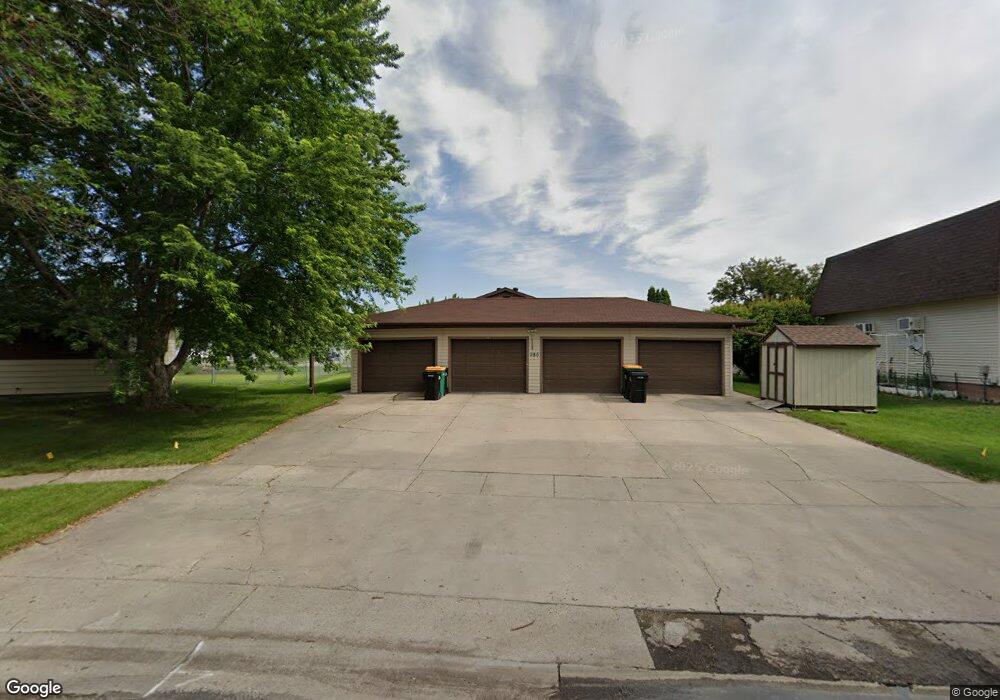
986 5th Ave W Unit A West Fargo, ND 58078
West Side NeighborhoodEstimated Value: $150,000 - $166,000
2
Beds
1
Bath
842
Sq Ft
$189/Sq Ft
Est. Value
About This Home
This home is located at 986 5th Ave W Unit A, West Fargo, ND 58078 and is currently estimated at $159,174, approximately $189 per square foot. 986 5th Ave W Unit A is a home located in Cass County with nearby schools including Westside Elementary School, Cheney Middle School, and West Fargo High School.
Ownership History
Date
Name
Owned For
Owner Type
Purchase Details
Closed on
Nov 20, 2013
Sold by
Federal National Mortgage Association
Bought by
Qualley Michael S
Current Estimated Value
Home Financials for this Owner
Home Financials are based on the most recent Mortgage that was taken out on this home.
Original Mortgage
$58,800
Interest Rate
4.31%
Mortgage Type
Commercial
Purchase Details
Closed on
Jul 16, 2013
Sold by
Alerus Financial N A
Bought by
Federal National Mortgage Association
Purchase Details
Closed on
Dec 28, 2006
Sold by
Kinder Joan H
Bought by
Seiler Paulette A
Home Financials for this Owner
Home Financials are based on the most recent Mortgage that was taken out on this home.
Original Mortgage
$71,200
Interest Rate
6.27%
Mortgage Type
New Conventional
Purchase Details
Closed on
Jul 19, 2005
Sold by
Sangrait Lisa
Bought by
Kinder Joan H
Home Financials for this Owner
Home Financials are based on the most recent Mortgage that was taken out on this home.
Original Mortgage
$80,600
Interest Rate
5.37%
Mortgage Type
FHA
Create a Home Valuation Report for This Property
The Home Valuation Report is an in-depth analysis detailing your home's value as well as a comparison with similar homes in the area
Home Values in the Area
Average Home Value in this Area
Purchase History
| Date | Buyer | Sale Price | Title Company |
|---|---|---|---|
| Qualley Michael S | -- | Multiple | |
| Federal National Mortgage Association | -- | None Available | |
| Seiler Paulette A | -- | -- | |
| Kinder Joan H | -- | -- |
Source: Public Records
Mortgage History
| Date | Status | Borrower | Loan Amount |
|---|---|---|---|
| Previous Owner | Qualley Michael S | $58,800 | |
| Previous Owner | Seiler Paulette A | $71,200 | |
| Previous Owner | Kinder Joan H | $80,600 |
Source: Public Records
Tax History Compared to Growth
Tax History
| Year | Tax Paid | Tax Assessment Tax Assessment Total Assessment is a certain percentage of the fair market value that is determined by local assessors to be the total taxable value of land and additions on the property. | Land | Improvement |
|---|---|---|---|---|
| 2024 | $1,973 | $67,600 | $7,500 | $60,100 |
| 2023 | $1,931 | $65,900 | $7,500 | $58,400 |
| 2022 | $1,917 | $62,650 | $7,500 | $55,150 |
| 2021 | $1,853 | $57,600 | $4,000 | $53,600 |
| 2020 | $1,834 | $58,300 | $4,000 | $54,300 |
| 2019 | $1,782 | $56,350 | $4,000 | $52,350 |
| 2018 | $1,628 | $53,900 | $4,000 | $49,900 |
| 2017 | $1,539 | $53,950 | $4,000 | $49,950 |
| 2016 | $1,273 | $49,650 | $4,000 | $45,650 |
| 2015 | $1,432 | $52,000 | $3,050 | $48,950 |
| 2014 | $1,399 | $48,600 | $3,050 | $45,550 |
| 2013 | $1,311 | $45,600 | $3,050 | $42,550 |
Source: Public Records
Map
Nearby Homes
- 986 5th Ave W Unit D
- 986 5th Ave W Unit C
- 986 5th Ave W Unit B
- 986 5th Ave W
- 986 5 Ave W
- 986 5 Ave W Unit 3
- 986 5 Ave W Unit B
- 986 5 Ave W Unit D
- 986 5 Ave W Unit C
- 986 5 Ave W Unit A
- 961 4th Ave W Unit D
- 961 4 Ave W
- 961 4th Ave W
- 961 4 Ave W Unit C
- 961 4 Ave W Unit B
- 961 4 Ave W Unit D
- 961 4th Ave W Unit STE C
- 974 5th Ave W Unit C
- 974 5th Ave W Unit B
- 974 5th Ave W