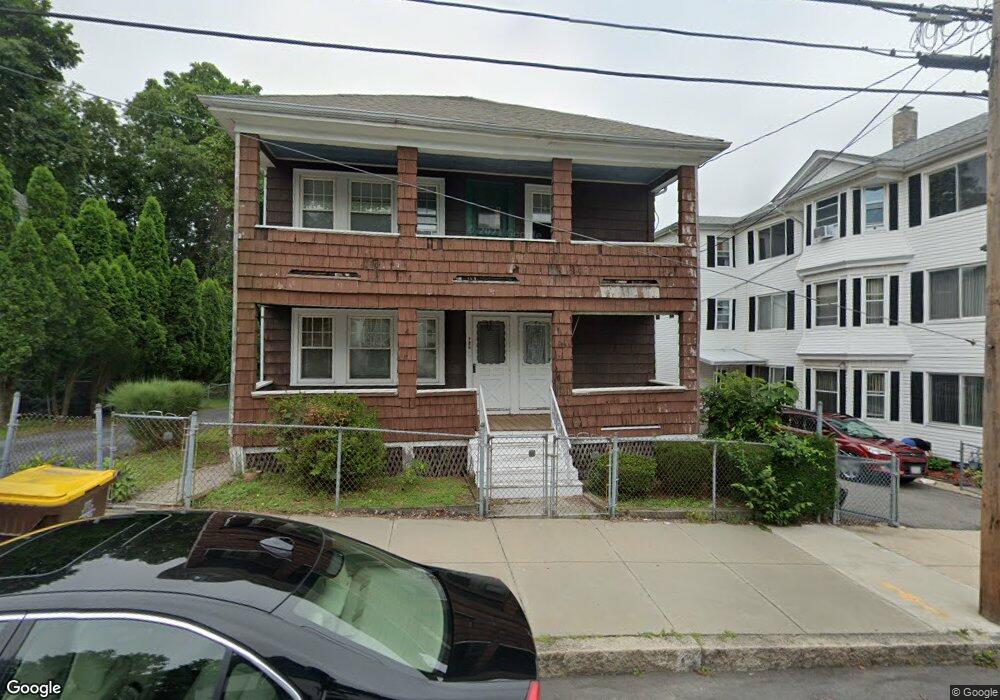
986 Rock St Fall River, MA 02720
Lower Highlands NeighborhoodEstimated Value: $474,015 - $545,000
4
Beds
2
Baths
2,128
Sq Ft
$234/Sq Ft
Est. Value
About This Home
This home is located at 986 Rock St, Fall River, MA 02720 and is currently estimated at $497,504, approximately $233 per square foot. 986 Rock St is a home located in Bristol County with nearby schools including Spencer Borden Elementary School, Morton Middle School, and B M C Durfee High School.
Ownership History
Date
Name
Owned For
Owner Type
Purchase Details
Closed on
Jun 29, 1999
Sold by
Household Fin Corp 2
Bought by
Hafey Joseph J
Current Estimated Value
Home Financials for this Owner
Home Financials are based on the most recent Mortgage that was taken out on this home.
Original Mortgage
$109,250
Interest Rate
7.09%
Mortgage Type
Purchase Money Mortgage
Create a Home Valuation Report for This Property
The Home Valuation Report is an in-depth analysis detailing your home's value as well as a comparison with similar homes in the area
Home Values in the Area
Average Home Value in this Area
Purchase History
| Date | Buyer | Sale Price | Title Company |
|---|---|---|---|
| Hafey Joseph J | $115,000 | -- | |
| Hafey Joseph J | $115,000 | -- |
Source: Public Records
Mortgage History
| Date | Status | Borrower | Loan Amount |
|---|---|---|---|
| Open | Hafey Joseph J | $130,000 | |
| Closed | Hafey Joseph J | $109,250 |
Source: Public Records
Tax History
| Year | Tax Paid | Tax Assessment Tax Assessment Total Assessment is a certain percentage of the fair market value that is determined by local assessors to be the total taxable value of land and additions on the property. | Land | Improvement |
|---|---|---|---|---|
| 2025 | $4,799 | $419,100 | $142,200 | $276,900 |
| 2024 | $4,428 | $385,400 | $136,700 | $248,700 |
| 2023 | $4,082 | $332,700 | $118,200 | $214,500 |
| 2022 | $3,795 | $300,700 | $110,500 | $190,200 |
| 2021 | $3,648 | $263,800 | $110,900 | $152,900 |
| 2020 | $3,394 | $234,900 | $111,100 | $123,800 |
| 2019 | $3,327 | $228,200 | $112,900 | $115,300 |
| 2018 | $3,206 | $219,300 | $112,900 | $106,400 |
| 2017 | $2,863 | $204,500 | $103,500 | $101,000 |
| 2016 | $2,755 | $202,100 | $103,500 | $98,600 |
| 2015 | $2,643 | $202,100 | $103,500 | $98,600 |
| 2014 | $2,558 | $203,300 | $96,600 | $106,700 |
Source: Public Records
Map
Nearby Homes
- 909 High St Unit 1
- 889 High St
- 327 Brownell St
- 33-35 Malvey St
- 11 Dyer St
- 267 Lincoln Ave
- 10 N Court St Unit 3
- 302 Cory St
- 503 Highland Ave
- 72 Belmont St
- 376 N Underwood St
- 750 Davol St Unit 1012
- 750 Davol St Unit 219
- 750 Davol St Unit 221
- 750 Davol St Unit 616
- 750 Davol St Unit 214
- 213 Weetamoe St
- 102 Vestal St
- 499 Hanover St
- 575 N Main St
Your Personal Tour Guide
Ask me questions while you tour the home.