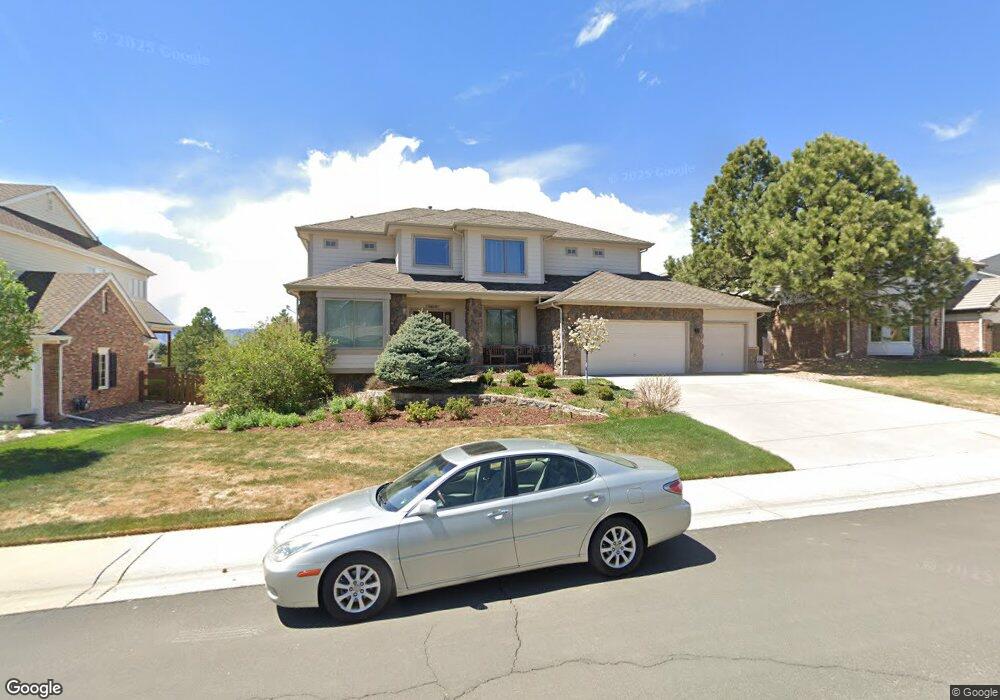
9869 Eliza Ct Highlands Ranch, CO 80126
Northridge NeighborhoodEstimated Value: $1,250,926 - $1,577,000
5
Beds
5
Baths
5,100
Sq Ft
$279/Sq Ft
Est. Value
About This Home
This home is located at 9869 Eliza Ct, Highlands Ranch, CO 80126 and is currently estimated at $1,423,482, approximately $279 per square foot. 9869 Eliza Ct is a home located in Douglas County with nearby schools including Bear Canyon Elementary School, Mountain Ridge Middle School, and Mountain Vista High School.
Ownership History
Date
Name
Owned For
Owner Type
Purchase Details
Closed on
Jun 15, 2010
Sold by
Wehrle Melanie M
Bought by
Newman Dennis J and Newman Jennifer T
Current Estimated Value
Home Financials for this Owner
Home Financials are based on the most recent Mortgage that was taken out on this home.
Original Mortgage
$417,000
Outstanding Balance
$276,856
Interest Rate
4.78%
Mortgage Type
New Conventional
Estimated Equity
$1,146,626
Purchase Details
Closed on
Jul 13, 2001
Sold by
Wehrle Mark S and Wehrle Melanie M
Bought by
Wehrle Melanie M
Purchase Details
Closed on
Jan 3, 1996
Sold by
Virden Homes Inc
Bought by
Wehrle Mark S and Wehrle Melanie M
Purchase Details
Closed on
Feb 8, 1995
Sold by
Bainbridge Inc
Bought by
Virden Homes Inc
Purchase Details
Closed on
Sep 16, 1994
Sold by
Mission Viejo Co
Bought by
Richmond Homes Inc Ii
Create a Home Valuation Report for This Property
The Home Valuation Report is an in-depth analysis detailing your home's value as well as a comparison with similar homes in the area
Home Values in the Area
Average Home Value in this Area
Purchase History
| Date | Buyer | Sale Price | Title Company |
|---|---|---|---|
| Newman Dennis J | $625,000 | Guardian Title | |
| Wehrle Melanie M | -- | -- | |
| Wehrle Mark S | $80,000 | Land Title | |
| Virden Homes Inc | $147,100 | -- | |
| Bainbridge Inc | $369,600 | -- | |
| Richmond Homes Inc Ii | $67,400 | -- |
Source: Public Records
Mortgage History
| Date | Status | Borrower | Loan Amount |
|---|---|---|---|
| Open | Newman Dennis J | $417,000 |
Source: Public Records
Tax History Compared to Growth
Tax History
| Year | Tax Paid | Tax Assessment Tax Assessment Total Assessment is a certain percentage of the fair market value that is determined by local assessors to be the total taxable value of land and additions on the property. | Land | Improvement |
|---|---|---|---|---|
| 2024 | $8,423 | $93,060 | $13,510 | $79,550 |
| 2023 | $8,408 | $93,060 | $13,510 | $79,550 |
| 2022 | $6,345 | $69,450 | $9,020 | $60,430 |
| 2021 | $6,600 | $69,450 | $9,020 | $60,430 |
| 2020 | $6,156 | $66,380 | $8,780 | $57,600 |
| 2019 | $6,179 | $66,380 | $8,780 | $57,600 |
| 2018 | $5,904 | $62,470 | $7,530 | $54,940 |
| 2017 | $5,376 | $62,470 | $7,530 | $54,940 |
| 2016 | $4,997 | $56,990 | $9,040 | $47,950 |
| 2015 | $5,104 | $56,990 | $9,040 | $47,950 |
| 2014 | $4,391 | $45,270 | $8,360 | $36,910 |
Source: Public Records
Map
Nearby Homes
- 1115 Kistler Ct
- 768 Poppywood Place
- 851 Hughes Ln
- 638 E Huntington Place
- 9750 Red Oakes Dr
- 9510 Joyce Ln
- 9492 Joyce Ln
- 10096 Hughes Place
- 9910 Ashleigh Way
- 842 Summer Dr Unit 3E
- 745 Stowe St
- 867 Summer Dr Unit 9C
- 795 Ridgemont Cir
- 9361 Crestmore Way
- 760 Ridgemont Cir
- 669 Walden Ct
- 1146 Cherry Blossom Ct
- 10480 Skyreach Rd
- 996 Cherry Blossom Ct
- 966 Cherry Blossom Ct
- 9859 Eliza Ct
- 9879 Eliza Ct
- 9849 Eliza Ct
- 9887 S Isabel Ct
- 9880 S Eliza Ct
- 9870 Eliza Ct
- 9880 Eliza Ct
- 9877 Isabel Ct
- 9860 Eliza Ct
- 9887 Isabel Ct
- 9890 Eliza Ct
- 9839 S Eliza Ct
- 9867 Isabel Ct
- 9850 Eliza Ct
- 1111 Phipps Place
- 1131 Phipps Place
- 9858 Isabel Ct
- 1091 Phipps Place
- 9857 Isabel Ct
- 9830 Eliza Ct