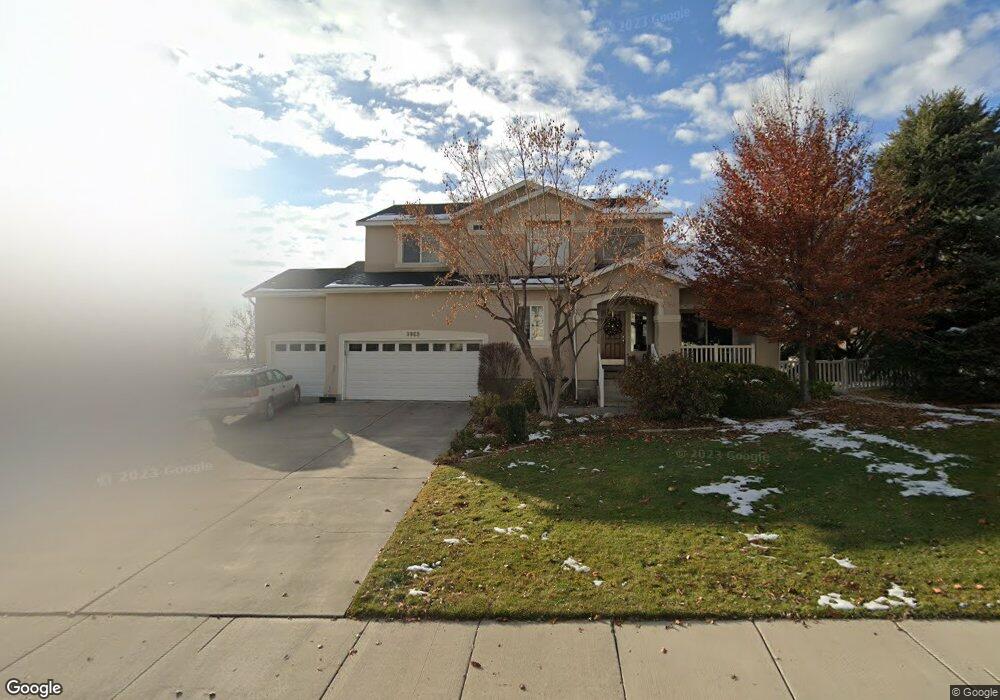
9869 N Deep Creek Dr Cedar Hills, UT 84062
Estimated Value: $746,000 - $792,815
6
Beds
4
Baths
3,621
Sq Ft
$213/Sq Ft
Est. Value
About This Home
This home is located at 9869 N Deep Creek Dr, Cedar Hills, UT 84062 and is currently estimated at $770,704, approximately $212 per square foot. 9869 N Deep Creek Dr is a home located in Utah County with nearby schools including Deerfield Elementary School, Mountain Ridge Junior High School, and Lone Peak High School.
Ownership History
Date
Name
Owned For
Owner Type
Purchase Details
Closed on
Apr 20, 2017
Sold by
Southworth Kerry M and Southworth Laureen S
Bought by
Wightman Peter and Wightman Stacy
Current Estimated Value
Home Financials for this Owner
Home Financials are based on the most recent Mortgage that was taken out on this home.
Original Mortgage
$365,750
Outstanding Balance
$304,359
Interest Rate
4.21%
Mortgage Type
New Conventional
Estimated Equity
$466,345
Purchase Details
Closed on
Feb 16, 1999
Sold by
Southworth Kerry and Southworth Laureen
Bought by
Southworth Kerry M and Southworth Laureen S
Home Financials for this Owner
Home Financials are based on the most recent Mortgage that was taken out on this home.
Original Mortgage
$224,000
Interest Rate
6.77%
Purchase Details
Closed on
May 28, 1997
Sold by
Ryland Group Inc
Bought by
Southworth Kerry and Southworth Laureen
Home Financials for this Owner
Home Financials are based on the most recent Mortgage that was taken out on this home.
Original Mortgage
$177,741
Interest Rate
7.91%
Create a Home Valuation Report for This Property
The Home Valuation Report is an in-depth analysis detailing your home's value as well as a comparison with similar homes in the area
Home Values in the Area
Average Home Value in this Area
Purchase History
| Date | Buyer | Sale Price | Title Company |
|---|---|---|---|
| Wightman Peter | -- | None Available | |
| Southworth Kerry M | -- | Summit Title Co | |
| Southworth Kerry | -- | -- |
Source: Public Records
Mortgage History
| Date | Status | Borrower | Loan Amount |
|---|---|---|---|
| Open | Wightman Peter | $365,750 | |
| Previous Owner | Southworth Kerry M | $224,000 | |
| Previous Owner | Southworth Kerry | $177,741 |
Source: Public Records
Tax History Compared to Growth
Tax History
| Year | Tax Paid | Tax Assessment Tax Assessment Total Assessment is a certain percentage of the fair market value that is determined by local assessors to be the total taxable value of land and additions on the property. | Land | Improvement |
|---|---|---|---|---|
| 2025 | $2,957 | $391,985 | $262,000 | $450,700 |
| 2024 | $2,957 | $350,240 | $0 | $0 |
| 2023 | $2,718 | $345,895 | $0 | $0 |
| 2022 | $2,931 | $364,320 | $0 | $0 |
| 2021 | $2,634 | $487,600 | $159,000 | $328,600 |
| 2020 | $2,453 | $443,200 | $147,200 | $296,000 |
| 2019 | $2,321 | $435,400 | $139,400 | $296,000 |
| 2018 | $2,262 | $399,900 | $131,700 | $268,200 |
| 2017 | $2,214 | $209,275 | $0 | $0 |
| 2016 | $2,191 | $192,610 | $0 | $0 |
| 2015 | $2,129 | $177,155 | $0 | $0 |
| 2014 | $1,946 | $160,765 | $0 | $0 |
Source: Public Records
Map
Nearby Homes
- 9900 N Meadow Dr
- 4198 W Sage Rd N
- 248 N Deerfield Ln
- 9681 N Peach Ct
- 4631 W Harvey Blvd
- 9587 N 4500 W
- 10207 N Cottonwood Dr
- 4441 W Bridgestone Dr
- 10052 N Marigold Ln
- 4696 W Camellia Ln
- 1172 Murdock Dr
- 4616 W Carriage Ln
- 4811 Pocosin Ct
- 4812 W Pocosin Ct
- 4812 Pocosin Ct
- 4821 W Pocosin Ct Unit 751
- 4816 Pocosin Ct
- 4816 W Pocosin Ct
- 3870 Mountaintop Cir
- 4822 W Pocosin Ct
- 9885 Deep Creek Dr
- 9855 N Deep Creek Dr
- 4340 W Mountain View Cir Unit 122
- 9901 Deep Creek Dr
- 4364 W Sunset Dr
- 4337 Cedar Creek Cir
- 4339 W Mountain View Cir
- 4326 W Mountain View Cir
- 9898 Dorchester Dr
- 4331 Cedar Creek Cir
- 9898 N Dorchester Dr
- 9838 Deep Creek Dr
- 9886 Dorchester Dr
- 9917 Deep Creek Dr
- 9917 N Deep Creek Dr
- 9868 Dorchester Dr
- 257 W Sunset Dr
- 9916 Dorchester Dr
- 9820 Deep Creek Dr
- 4336 Cedar Creek Cir