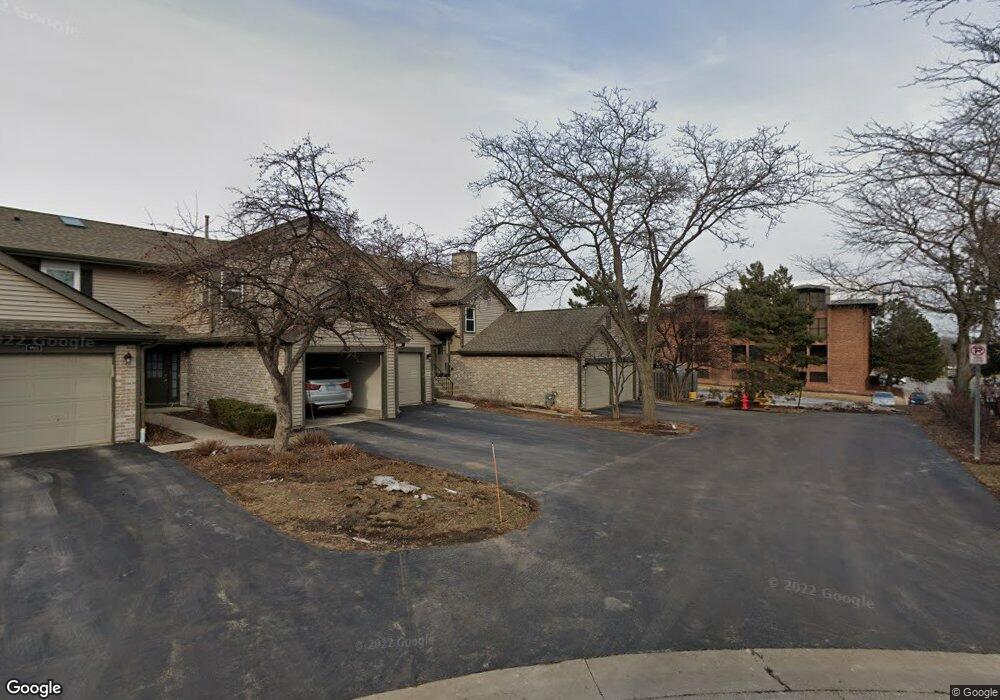
987 Butter Creek Ct Unit 3NB Hoffman Estates, IL 60169
South Hoffman Estates NeighborhoodEstimated Value: $277,000 - $325,000
2
Beds
--
Bath
1,225
Sq Ft
$248/Sq Ft
Est. Value
About This Home
This home is located at 987 Butter Creek Ct Unit 3NB, Hoffman Estates, IL 60169 and is currently estimated at $304,086, approximately $248 per square foot. 987 Butter Creek Ct Unit 3NB is a home located in Cook County with nearby schools including Lakeview Elementary School, Helen Keller Junior High School, and J B Conant High School.
Ownership History
Date
Name
Owned For
Owner Type
Purchase Details
Closed on
Mar 17, 2003
Sold by
Mora Ronald W
Bought by
Alabado Alfonso A and Alabado May Agnes C
Current Estimated Value
Home Financials for this Owner
Home Financials are based on the most recent Mortgage that was taken out on this home.
Original Mortgage
$151,762
Outstanding Balance
$64,670
Interest Rate
5.76%
Estimated Equity
$239,416
Purchase Details
Closed on
Apr 30, 1997
Sold by
Patrician James P
Bought by
Mora Ronald W
Home Financials for this Owner
Home Financials are based on the most recent Mortgage that was taken out on this home.
Original Mortgage
$92,000
Interest Rate
8.17%
Mortgage Type
Balloon
Purchase Details
Closed on
May 20, 1994
Sold by
Mamaril Marie M and Marzano Marie M
Bought by
Patricia James P
Home Financials for this Owner
Home Financials are based on the most recent Mortgage that was taken out on this home.
Original Mortgage
$90,000
Interest Rate
6.75%
Create a Home Valuation Report for This Property
The Home Valuation Report is an in-depth analysis detailing your home's value as well as a comparison with similar homes in the area
Home Values in the Area
Average Home Value in this Area
Purchase History
| Date | Buyer | Sale Price | Title Company |
|---|---|---|---|
| Alabado Alfonso A | $160,000 | -- | |
| Alabado Alfonso A | $160,000 | -- | |
| Mora Ronald W | $104,500 | Attorneys Natl Title Network | |
| Patricia James P | $100,000 | -- |
Source: Public Records
Mortgage History
| Date | Status | Borrower | Loan Amount |
|---|---|---|---|
| Open | Alabado Alfonso A | $151,762 | |
| Closed | Alabado Alfonso A | $151,762 | |
| Previous Owner | Mora Ronald W | $92,000 | |
| Previous Owner | Patricia James P | $90,000 |
Source: Public Records
Tax History Compared to Growth
Tax History
| Year | Tax Paid | Tax Assessment Tax Assessment Total Assessment is a certain percentage of the fair market value that is determined by local assessors to be the total taxable value of land and additions on the property. | Land | Improvement |
|---|---|---|---|---|
| 2024 | $5,131 | $20,036 | $3,020 | $17,016 |
| 2023 | $4,934 | $20,036 | $3,020 | $17,016 |
| 2022 | $4,934 | $20,036 | $3,020 | $17,016 |
| 2021 | $4,158 | $15,740 | $3,624 | $12,116 |
| 2020 | $4,135 | $15,740 | $3,624 | $12,116 |
| 2019 | $4,189 | $17,739 | $3,624 | $14,115 |
| 2018 | $3,498 | $14,162 | $3,020 | $11,142 |
| 2017 | $3,455 | $14,162 | $3,020 | $11,142 |
| 2016 | $3,475 | $14,162 | $3,020 | $11,142 |
| 2015 | $3,013 | $12,004 | $2,642 | $9,362 |
| 2014 | $2,977 | $12,004 | $2,642 | $9,362 |
| 2013 | $2,882 | $12,004 | $2,642 | $9,362 |
Source: Public Records
Map
Nearby Homes
- 989 Butter Creek Ct Unit 3NE
- 363 Oaktree Ct
- 365 Juniper Tree Ct
- 520 Hill Dr Unit 203
- 370 Flagstaff Ln
- 615 Hill Dr Unit 303
- 1195 Meadow Ln Unit 114
- 1195 Meadow Ln Unit 213
- 1345 Jefferson Rd
- 1080 Knoll Ln Unit 305
- 720 Hill Dr Unit 8303
- 730 Hill Dr Unit 9205
- 565 Flagstaff Ln
- 1025 Higgins Quarters Dr Unit 4-109
- 1085 Higgins Quarters Dr Unit 104
- 1075 Higgins Quarters Dr Unit 3-208
- 100 Des Plaines Ln
- 700 Cumberland St
- 1180 Apple St
- 1190 Apple St
- 985 Butter Creek Ct Unit 3NA
- 991 Butter Creek Ct Unit 3ND
- 993 Butter Creek Ct Unit 3NC
- 995 Butter Creek Ct Unit 3ND
- 997 Butter Creek Ct Unit 3NB
- 981 Butter Creek Ct Unit 2NB
- 983 Butter Creek Ct Unit 2NA
- 999 Butter Creek Ct Unit 3NA
- 979 Butter Creek Ct Unit 2ND
- 975 Butter Creek Ct Unit 2ND
- 977 Butter Creek Ct Unit 2NC
- 971 Butter Creek Ct Unit 2NB
- 969 Butter Creek Ct Unit 2NA
- 275 W Higgins Rd
- 990 Grand Canyon Pkwy
- 998 Butter Creek Ct Unit 4NA
- 996 Butter Creek Ct Unit 4NB
- 996 Butter Creek Ct Unit 996
- 992 Butter Creek Ct Unit 4ND
- 990 Butter Creek Ct Unit 4NC