


987 N 55th Rd Glasco, KS 67445
Estimated payment $4,763/month
Total Views
5,319
155
Acres
$5,161
Price per Acre
6,751,800
Sq Ft Lot
About This Lot
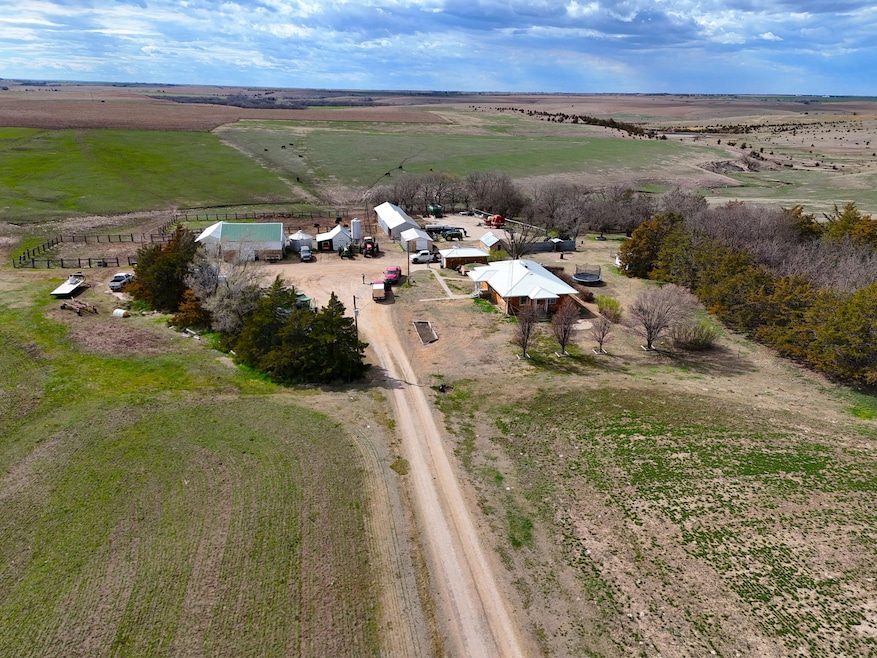
Nice Cloud County farm, ranch, and home for sale located 12 miles SW of Concordia, KS. This 3-bedroom, 1 bathroom home has a full basement. The property conveniently has rural water and is protected from the wind by shelter belts on both the north and the south sides. The real estate consists of 155 acres - 105 acres of good upland soil and 45 acres of grass with no trees. There are several outbuildings and a barn with pens for livestock. Access is a good gravel road. The rights to the farm could be immediately upon closing. If you are looking for a place in the country with a good foundation for many different avenues, dont miss this one.
Call Larry Koch for your private showing today!
(785) 243-5150
Listing Provided By

Property Details
Property Type
- Land
Est. Annual Taxes
- $4,135
Lot Details
- Rural Setting
- Level Lot
- Few Trees
- Current uses include agriculture, residential single
- Potential uses include agriculture, residential single
Farming
- Pasture
Map
Create a Home Valuation Report for This Property
The Home Valuation Report is an in-depth analysis detailing your home's value as well as a comparison with similar homes in the area
Home Values in the Area
Average Home Value in this Area
Tax History
| Year | Tax Paid | Tax Assessment Tax Assessment Total Assessment is a certain percentage of the fair market value that is determined by local assessors to be the total taxable value of land and additions on the property. | Land | Improvement |
|---|---|---|---|---|
| 2024 | $4,135 | $28,200 | $13,915 | $14,285 |
| 2023 | $4,076 | $27,733 | $15,537 | $12,196 |
| 2022 | $4,128 | $26,874 | $16,734 | $10,140 |
| 2021 | $4,128 | $26,874 | $16,734 | $10,140 |
| 2020 | $4,128 | $27,031 | $16,853 | $10,178 |
| 2019 | $4,133 | $26,238 | $16,340 | $9,898 |
| 2018 | $4,089 | $24,914 | $15,142 | $9,772 |
| 2017 | $3,934 | $23,421 | $13,723 | $9,698 |
| 2016 | $3,633 | $21,511 | $12,076 | $9,435 |
| 2015 | -- | $20,389 | $10,729 | $9,660 |
| 2014 | -- | $18,754 | $9,369 | $9,385 |
Source: Public Records
Property History
| Date | Event | Price | Change | Sq Ft Price |
|---|---|---|---|---|
| 03/24/2025 03/24/25 | For Sale | $800,000 | -- | $680 / Sq Ft |
Nearby Homes