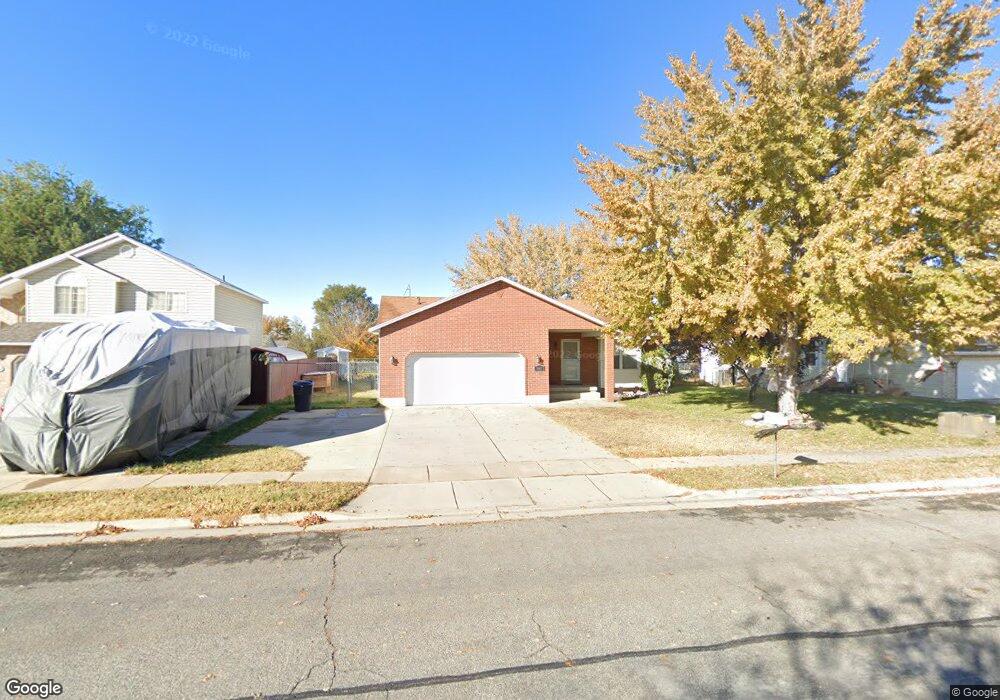
987 N 575 W Clearfield, UT 84015
Estimated Value: $463,000 - $479,034
3
Beds
2
Baths
2,552
Sq Ft
$185/Sq Ft
Est. Value
About This Home
This home is located at 987 N 575 W, Clearfield, UT 84015 and is currently estimated at $472,509, approximately $185 per square foot. 987 N 575 W is a home located in Davis County with nearby schools including Clinton Elementary School, Sunset Junior High School, and Clearfield High School.
Ownership History
Date
Name
Owned For
Owner Type
Purchase Details
Closed on
Mar 23, 2021
Sold by
Freeland Donnette M
Bought by
Authentic Residential Llc
Current Estimated Value
Purchase Details
Closed on
Jul 13, 2004
Sold by
Ravenberg Brian G and Ravenberg Lauralee
Bought by
Freeland Donnette M
Home Financials for this Owner
Home Financials are based on the most recent Mortgage that was taken out on this home.
Original Mortgage
$103,500
Interest Rate
6.27%
Mortgage Type
Purchase Money Mortgage
Purchase Details
Closed on
Jul 26, 1999
Sold by
Nelson Brent W and Nelson Cynthia A
Bought by
Ravenberg Brian G and Ravenberg Laurelee
Home Financials for this Owner
Home Financials are based on the most recent Mortgage that was taken out on this home.
Original Mortgage
$112,000
Interest Rate
7.51%
Create a Home Valuation Report for This Property
The Home Valuation Report is an in-depth analysis detailing your home's value as well as a comparison with similar homes in the area
Home Values in the Area
Average Home Value in this Area
Purchase History
| Date | Buyer | Sale Price | Title Company |
|---|---|---|---|
| Authentic Residential Llc | -- | Hickman Land Title Co | |
| Freeland Donnette M | -- | Founders Title Co | |
| Ravenberg Brian G | -- | Bonneville Title Company Inc |
Source: Public Records
Mortgage History
| Date | Status | Borrower | Loan Amount |
|---|---|---|---|
| Previous Owner | Freeland Donnette M | $103,500 | |
| Previous Owner | Ravenberg Brian G | $112,000 |
Source: Public Records
Tax History Compared to Growth
Tax History
| Year | Tax Paid | Tax Assessment Tax Assessment Total Assessment is a certain percentage of the fair market value that is determined by local assessors to be the total taxable value of land and additions on the property. | Land | Improvement |
|---|---|---|---|---|
| 2025 | $2,631 | $253,000 | $83,060 | $169,940 |
| 2024 | $2,521 | $243,649 | $92,023 | $151,626 |
| 2023 | $2,320 | $228,250 | $56,889 | $171,360 |
| 2022 | $2,485 | $447,000 | $117,871 | $329,129 |
| 2021 | $2,276 | $334,000 | $78,534 | $255,466 |
| 2020 | $1,831 | $266,000 | $65,378 | $200,622 |
| 2019 | $1,804 | $256,000 | $78,924 | $177,076 |
| 2018 | $1,607 | $224,000 | $66,998 | $157,002 |
| 2016 | $1,481 | $106,645 | $25,800 | $80,845 |
| 2015 | $1,389 | $95,040 | $25,800 | $69,240 |
| 2014 | $1,571 | $109,261 | $25,800 | $83,461 |
| 2013 | -- | $92,540 | $27,143 | $65,397 |
Source: Public Records
Map
Nearby Homes