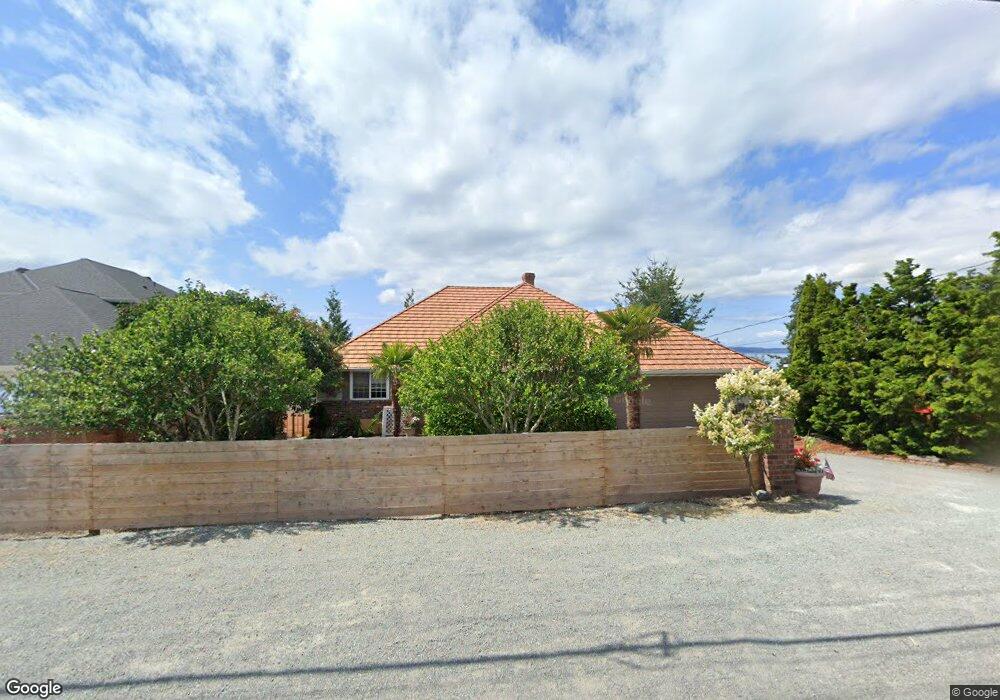
987 N West Camano Dr Camano Island, WA 98282
Estimated Value: $1,014,000 - $1,252,000
2
Beds
3
Baths
2,820
Sq Ft
$392/Sq Ft
Est. Value
About This Home
This home is located at 987 N West Camano Dr, Camano Island, WA 98282 and is currently estimated at $1,105,273, approximately $391 per square foot. 987 N West Camano Dr is a home located in Island County with nearby schools including Utsalady Elementary School, Port Susan Middle School, and Stanwood High School.
Ownership History
Date
Name
Owned For
Owner Type
Purchase Details
Closed on
Jul 28, 2015
Sold by
Clark Rick D and Clark Sherrie A
Bought by
Roxbury Olinda and Roxbury Michael
Current Estimated Value
Purchase Details
Closed on
Sep 19, 2011
Sold by
Fannie Mae
Bought by
Clark Rick D and Clark Sherrie A
Purchase Details
Closed on
Jul 11, 2011
Sold by
Rowland O Bruce and Rowland Katherine M
Bought by
Fannie Mae
Purchase Details
Closed on
Jun 14, 2006
Sold by
Rowland O Bruce and Rowland Katherine M
Bought by
Rowland O Bruce and Rowland Katherine M
Home Financials for this Owner
Home Financials are based on the most recent Mortgage that was taken out on this home.
Original Mortgage
$330,000
Interest Rate
6.55%
Mortgage Type
Fannie Mae Freddie Mac
Purchase Details
Closed on
Sep 27, 2005
Sold by
Rowland O Bruce and Rowland Katherine M
Bought by
Rowland O Bruce and Rowland Katherine M
Create a Home Valuation Report for This Property
The Home Valuation Report is an in-depth analysis detailing your home's value as well as a comparison with similar homes in the area
Home Values in the Area
Average Home Value in this Area
Purchase History
| Date | Buyer | Sale Price | Title Company |
|---|---|---|---|
| Roxbury Olinda | $527,500 | Land Title & Escrow Of Islan | |
| Clark Rick D | $295,000 | Chicago Title Company | |
| Fannie Mae | $331,739 | 1St Am | |
| Rowland O Bruce | -- | Chicago Title Co Island Div | |
| Rowland O Bruce | -- | -- |
Source: Public Records
Mortgage History
| Date | Status | Borrower | Loan Amount |
|---|---|---|---|
| Previous Owner | Rowland O Bruce | $330,000 |
Source: Public Records
Tax History Compared to Growth
Tax History
| Year | Tax Paid | Tax Assessment Tax Assessment Total Assessment is a certain percentage of the fair market value that is determined by local assessors to be the total taxable value of land and additions on the property. | Land | Improvement |
|---|---|---|---|---|
| 2024 | $8,122 | $1,048,425 | $390,000 | $658,425 |
| 2023 | $8,122 | $1,066,061 | $400,000 | $666,061 |
| 2022 | $7,245 | $960,022 | $350,000 | $610,022 |
| 2021 | $7,055 | $786,465 | $250,000 | $536,465 |
| 2020 | $6,701 | $741,680 | $220,000 | $521,680 |
| 2019 | $6,311 | $695,591 | $290,000 | $405,591 |
| 2018 | $5,770 | $656,703 | $250,000 | $406,703 |
| 2017 | $4,953 | $555,927 | $165,000 | $390,927 |
| 2016 | -- | $530,548 | $135,000 | $395,548 |
| 2015 | $894 | $375,512 | $100,000 | $275,512 |
| 2013 | -- | $369,250 | $100,000 | $269,250 |
Source: Public Records
Map
Nearby Homes
- 688 Gladstone Dr
- 938 NW Camano Dr
- 1021 N Sunset Dr
- 897 James Way
- 746 Maple Grove Rd
- 641 Maple Grove Rd
- 1042 Shorecrest Place
- 931 Karen Ann Dr
- 1048 Malvern Hills Dr
- 628 N Sunset Dr
- 366 Samanthia Ln
- 298 Echo Ridge Way
- 1048 Cassius Ct
- 250 Fay Ln
- 941 Cambell Dr
- 870 Cambell Dr
- 0 Cambell Dr Unit NWM2331086
- 435 NW Camano Dr
- 435 Thumper Ln
- 162 Loon Asea Ln
- 987 NW Camano Dr
- 985 NW Camano Dr
- 993 N West Camano Dr
- 993 N W-Camano Dr
- 975 N West Camano Dr
- 662 W Gladstone Dr
- 668 Gladstone Dr
- 674 Gladstone Dr
- 662 Gladstone Dr
- 971 N West Camano Dr
- 980 NW Camano Dr
- 980 N West Camano Dr
- 705 Brokaw Rd
- 682 Gladstone Dr
- 656 Gladstone Dr
- 693 W North Camano Dr
- 693 W North Camano Dr Unit B
- 691 NW Camano Dr
- 967 NW Camano Dr
- 967 NW Camano Dr