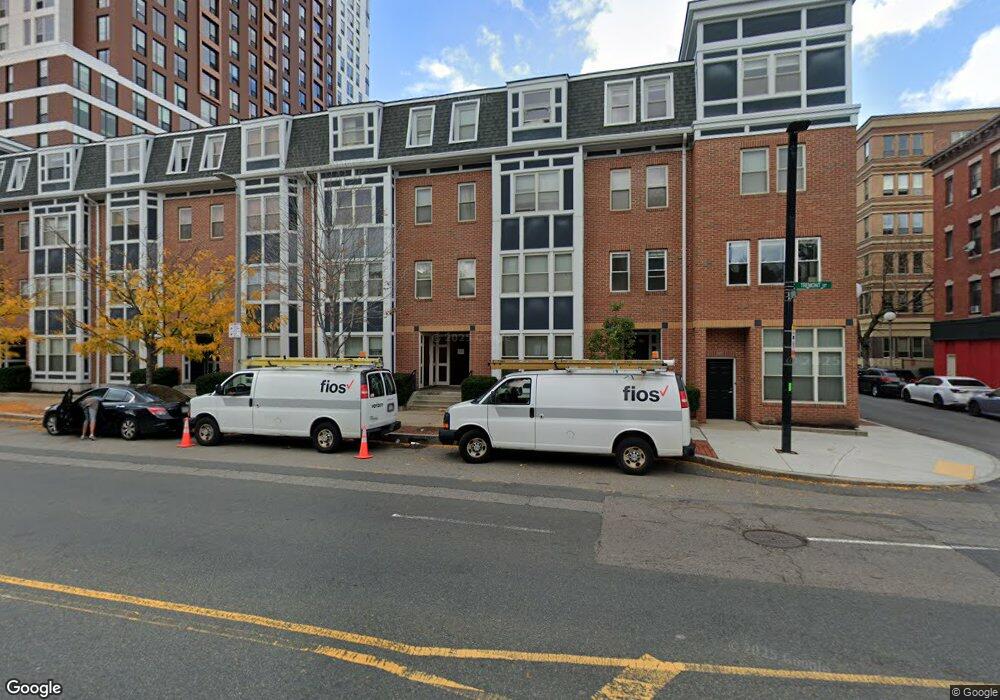
987 Tremont St Unit 1 Roxbury Crossing, MA 02120
Lower Roxbury NeighborhoodEstimated Value: $260,000 - $681,000
1
Bed
1
Bath
710
Sq Ft
$659/Sq Ft
Est. Value
About This Home
This home is located at 987 Tremont St Unit 1, Roxbury Crossing, MA 02120 and is currently estimated at $467,690, approximately $658 per square foot. 987 Tremont St Unit 1 is a home located in Suffolk County with nearby schools including Edward M. Kennedy Academy for Health Careers.
Ownership History
Date
Name
Owned For
Owner Type
Purchase Details
Closed on
Feb 27, 2013
Sold by
Keenan Barbara T Est
Bought by
Walsh Patrick
Current Estimated Value
Purchase Details
Closed on
Apr 30, 2001
Sold by
Madison Davenport Inc
Bought by
Keenan Barbara T
Home Financials for this Owner
Home Financials are based on the most recent Mortgage that was taken out on this home.
Original Mortgage
$70,155
Interest Rate
6.88%
Mortgage Type
Purchase Money Mortgage
Create a Home Valuation Report for This Property
The Home Valuation Report is an in-depth analysis detailing your home's value as well as a comparison with similar homes in the area
Home Values in the Area
Average Home Value in this Area
Purchase History
| Date | Buyer | Sale Price | Title Company |
|---|---|---|---|
| Walsh Patrick | $153,500 | -- | |
| Keenan Barbara T | $94,900 | -- |
Source: Public Records
Mortgage History
| Date | Status | Borrower | Loan Amount |
|---|---|---|---|
| Previous Owner | Keenan Barbara T | $70,155 | |
| Closed | Keenan Barbara T | $20,000 |
Source: Public Records
Tax History Compared to Growth
Tax History
| Year | Tax Paid | Tax Assessment Tax Assessment Total Assessment is a certain percentage of the fair market value that is determined by local assessors to be the total taxable value of land and additions on the property. | Land | Improvement |
|---|---|---|---|---|
| 2025 | $3,217 | $277,800 | $0 | $277,800 |
| 2024 | $2,884 | $264,600 | $0 | $264,600 |
| 2023 | $2,706 | $252,000 | $0 | $252,000 |
| 2022 | $2,611 | $240,000 | $0 | $240,000 |
| 2021 | $2,439 | $228,600 | $0 | $228,600 |
| 2020 | $2,299 | $217,700 | $0 | $217,700 |
| 2019 | $2,185 | $207,300 | $0 | $207,300 |
| 2018 | $2,069 | $197,400 | $0 | $197,400 |
| 2017 | $1,991 | $188,000 | $0 | $188,000 |
| 2016 | $1,969 | $179,000 | $0 | $179,000 |
| 2015 | $2,065 | $170,500 | $0 | $170,500 |
| 2014 | $2,043 | $162,400 | $0 | $162,400 |
Source: Public Records
Map
Nearby Homes
- 592 Columbus Ave Unit 1
- 491 Massachusetts Ave Unit 1
- 483 Massachusetts Ave Unit 7
- 451-453 Massachusetts Ave Unit 8
- 484 Massachusetts Ave Unit 1
- 32 Williams St Unit 1
- 504 Massachusetts Ave Unit 3
- 270 Huntington Ave Unit 304
- 771 Tremont St Unit 2
- 530 Massachusetts Ave Unit 2
- 577 Massachusetts Ave Unit C
- 548 Massachusetts Ave Unit 3
- 193 W Springfield St
- 570 Massachusetts Ave Unit 5
- 2149 Washington St Unit 604
- 2149 Washington St Unit 610
- 8-14 Newcomb St Unit 4
- 605 Massachusetts Ave Unit A
- 221 W Springfield St Unit 3
- 144 Worcester St Unit 2
- 987 Tremont St Unit 3
- 987 Tremont St Unit 2
- 987 Tremont St
- 989 Tremont St Unit 4
- 989 Tremont St Unit 3
- 989 Tremont St Unit 2
- 989 Tremont St Unit 1
- 989 Tremont St
- 991 Tremont St Unit 4
- 991 Tremont St Unit 3
- 991 Tremont St Unit 2
- 991 Tremont St Unit 1
- 991 Tremont St
- 995 Tremont St
- 993 Tremont St Unit 5
- 993 Tremont St Unit 4
- 993 Tremont St Unit 3
- 993 Tremont St Unit 2
- 993 Tremont St Unit 1
- 985 Tremont St