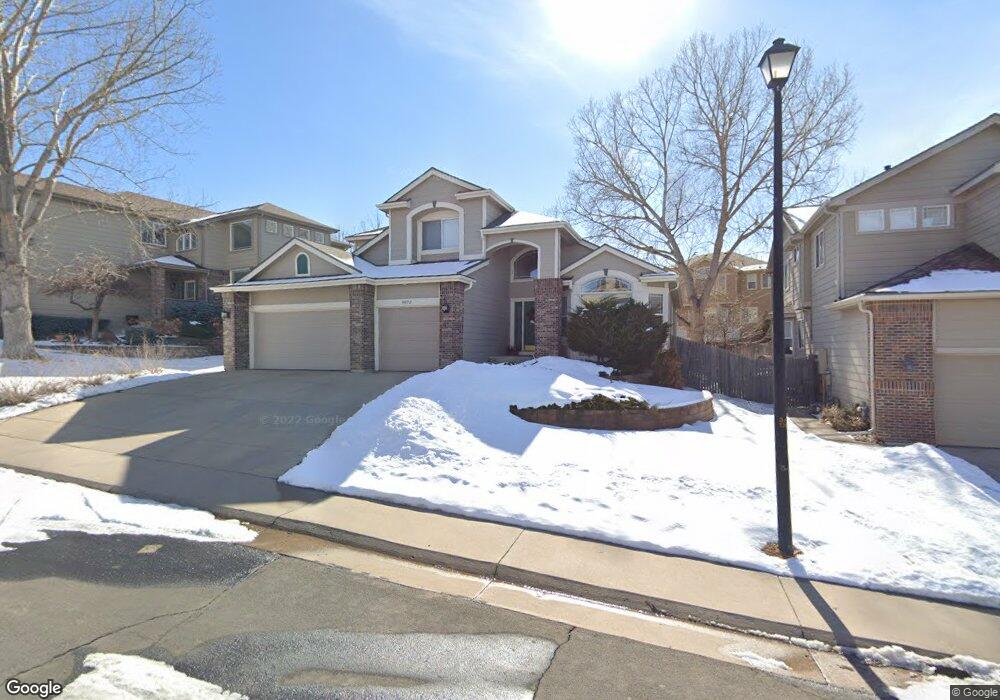
9873 Quay Way Westminster, CO 80021
Westcliff & Cambridge NeighborhoodEstimated Value: $709,414 - $881,000
4
Beds
4
Baths
3,581
Sq Ft
$218/Sq Ft
Est. Value
About This Home
This home is located at 9873 Quay Way, Westminster, CO 80021 and is currently estimated at $781,354, approximately $218 per square foot. 9873 Quay Way is a home located in Jefferson County with nearby schools including Semper Elementary School, Mandalay Middle School, and Standley Lake High School.
Ownership History
Date
Name
Owned For
Owner Type
Purchase Details
Closed on
Apr 27, 2011
Sold by
Gunning Stephen B and Gunning Margaret F
Bought by
Tran Hoang M and Hoang An T
Current Estimated Value
Home Financials for this Owner
Home Financials are based on the most recent Mortgage that was taken out on this home.
Original Mortgage
$272,000
Outstanding Balance
$188,504
Interest Rate
4.82%
Mortgage Type
New Conventional
Estimated Equity
$592,850
Purchase Details
Closed on
Sep 27, 2002
Sold by
Grosenick Steven C and Grosenick Michele K
Bought by
Gunning Stephen B and Gunning Margaret F
Home Financials for this Owner
Home Financials are based on the most recent Mortgage that was taken out on this home.
Original Mortgage
$145,000
Interest Rate
6.09%
Purchase Details
Closed on
Sep 27, 1996
Sold by
D R Horton Inc
Bought by
Grosenick Michele K and Grosenick Steven C
Home Financials for this Owner
Home Financials are based on the most recent Mortgage that was taken out on this home.
Original Mortgage
$170,000
Interest Rate
7.25%
Create a Home Valuation Report for This Property
The Home Valuation Report is an in-depth analysis detailing your home's value as well as a comparison with similar homes in the area
Home Values in the Area
Average Home Value in this Area
Purchase History
| Date | Buyer | Sale Price | Title Company |
|---|---|---|---|
| Tran Hoang M | $340,000 | None Available | |
| Gunning Stephen B | $345,000 | -- | |
| Grosenick Michele K | $212,000 | Land Title |
Source: Public Records
Mortgage History
| Date | Status | Borrower | Loan Amount |
|---|---|---|---|
| Open | Tran Hoang M | $272,000 | |
| Previous Owner | Gunning Stephen B | $145,000 | |
| Previous Owner | Grosenick Michele K | $170,000 |
Source: Public Records
Tax History Compared to Growth
Tax History
| Year | Tax Paid | Tax Assessment Tax Assessment Total Assessment is a certain percentage of the fair market value that is determined by local assessors to be the total taxable value of land and additions on the property. | Land | Improvement |
|---|---|---|---|---|
| 2024 | $3,332 | $41,336 | $12,459 | $28,877 |
| 2023 | $3,332 | $41,336 | $12,459 | $28,877 |
| 2022 | $2,910 | $35,319 | $8,510 | $26,809 |
| 2021 | $2,953 | $36,335 | $8,755 | $27,580 |
| 2020 | $2,738 | $33,848 | $8,365 | $25,483 |
| 2019 | $2,695 | $33,848 | $8,365 | $25,483 |
| 2018 | $2,598 | $31,520 | $6,924 | $24,596 |
| 2017 | $2,340 | $31,520 | $6,924 | $24,596 |
| 2016 | $2,478 | $31,076 | $6,233 | $24,843 |
| 2015 | $2,174 | $31,076 | $6,233 | $24,843 |
| 2014 | $2,174 | $25,361 | $5,572 | $19,789 |
Source: Public Records
Map
Nearby Homes
- 6794 W 98th Cir
- 6598 W 96th Dr
- 6563 W 96th Place
- 10245 Wadsworth Blvd
- 9657 Kendall Ct
- 9495 Webster Way
- 6620 W 95th Place
- 9405 Otis St
- 9863 Zephyr Dr
- 6401 W 95th Ave
- 6317 W 95th Ave
- 6319 W 95th Ave
- 9281 Upham Way
- 7423 W 93rd Place
- 6200 W 95th Ave
- 9251 Wadsworth Blvd
- 9322 Kendall St
- 9304 Kendall St
- 9530 Gray St
- 10690 Dover St