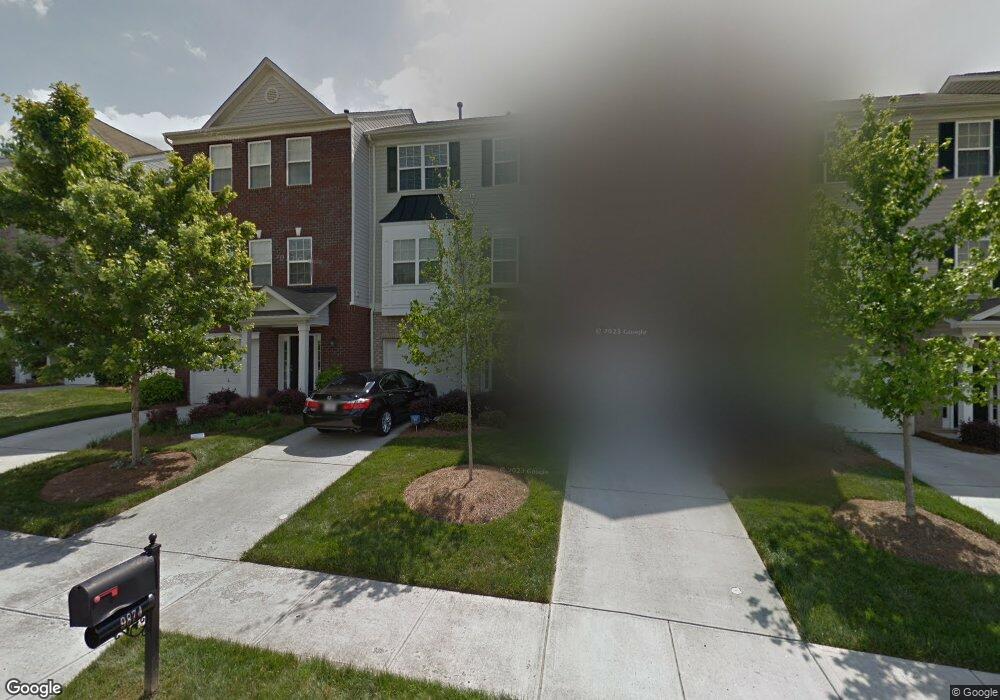
9874 Walkers Glen Dr NW Unit M3 74 Concord, NC 28027
Estimated Value: $317,000 - $347,000
4
Beds
4
Baths
1,959
Sq Ft
$167/Sq Ft
Est. Value
About This Home
This home is located at 9874 Walkers Glen Dr NW Unit M3 74, Concord, NC 28027 and is currently estimated at $327,513, approximately $167 per square foot. 9874 Walkers Glen Dr NW Unit M3 74 is a home located in Cabarrus County with nearby schools including W.R. Odell Elementary School, Harris Road Middle, and Cox Mill High School.
Ownership History
Date
Name
Owned For
Owner Type
Purchase Details
Closed on
Sep 10, 2013
Sold by
Hawkins Demaura K
Bought by
Vry Investments Inc
Current Estimated Value
Purchase Details
Closed on
Dec 11, 2009
Sold by
Nicholls Michael D and Nicholls Jacqueline M
Bought by
Hawkins Demaura K
Home Financials for this Owner
Home Financials are based on the most recent Mortgage that was taken out on this home.
Original Mortgage
$134,192
Interest Rate
3.75%
Mortgage Type
FHA
Purchase Details
Closed on
May 9, 2008
Sold by
Mccar Homes Charlotte Llc
Bought by
Nicholls Michael D
Home Financials for this Owner
Home Financials are based on the most recent Mortgage that was taken out on this home.
Original Mortgage
$166,200
Interest Rate
5.82%
Mortgage Type
FHA
Purchase Details
Closed on
Jun 21, 2007
Sold by
J & B Development & Management Inc
Bought by
Mccar Homes Charlotte Llc
Create a Home Valuation Report for This Property
The Home Valuation Report is an in-depth analysis detailing your home's value as well as a comparison with similar homes in the area
Home Values in the Area
Average Home Value in this Area
Purchase History
| Date | Buyer | Sale Price | Title Company |
|---|---|---|---|
| Vry Investments Inc | $132,500 | None Available | |
| Hawkins Demaura K | $136,000 | None Available | |
| Nicholls Michael D | $169,000 | None Available | |
| Mccar Homes Charlotte Llc | $241,000 | None Available |
Source: Public Records
Mortgage History
| Date | Status | Borrower | Loan Amount |
|---|---|---|---|
| Previous Owner | Hawkins Demaura K | $134,192 | |
| Previous Owner | Nicholls Michael D | $166,200 |
Source: Public Records
Tax History Compared to Growth
Tax History
| Year | Tax Paid | Tax Assessment Tax Assessment Total Assessment is a certain percentage of the fair market value that is determined by local assessors to be the total taxable value of land and additions on the property. | Land | Improvement |
|---|---|---|---|---|
| 2025 | $3,078 | $309,070 | $63,000 | $246,070 |
| 2024 | $3,078 | $309,070 | $63,000 | $246,070 |
| 2023 | $2,487 | $203,890 | $36,000 | $167,890 |
| 2022 | $2,487 | $203,890 | $36,000 | $167,890 |
| 2021 | $2,487 | $203,890 | $36,000 | $167,890 |
| 2020 | $2,487 | $203,890 | $36,000 | $167,890 |
| 2019 | $1,780 | $145,920 | $19,000 | $126,920 |
| 2018 | $1,751 | $145,920 | $19,000 | $126,920 |
| 2017 | $1,722 | $145,920 | $19,000 | $126,920 |
| 2016 | $1,021 | $145,740 | $12,800 | $132,940 |
| 2015 | $1,720 | $145,740 | $12,800 | $132,940 |
| 2014 | $1,720 | $145,740 | $12,800 | $132,940 |
Source: Public Records
Map
Nearby Homes
- 1266 Amber Ridge Rd NW
- 9803 Walkers Glen Dr NW
- 9768 Walkers Glen Dr NW
- 9720 Walkers Glen Dr NW
- 9610 Walkers Glen Dr NW
- 1498 Burrell Ave NW
- 1418 Skidaway St NW Unit 427
- 9611 Marquette St NW
- 9430 Pepperidge Ave NW
- 1423 Napa St NW
- 9711 Marquette St NW
- 9593 Valencia Ave NW
- 9618 Teamwork St NW
- 1484 Haverford Rd NW
- 1559 Broderick St NW
- 1656 Respect St NW
- 1648 Respect St NW
- 9515 Coast Laurel Ave NW
- 9532 Teamwork St NW
- 9528 Teamwork St NW
- 9874 Walkers Glen Dr NW
- 9870 Walkers Glen Dr NW
- 9870 Walkers Glen Dr NW Unit 75
- 9870 Walkers Glen Dr NW Unit M3 75
- 9878 Walkers Glen Dr NW
- 9878 Walkers Glen Dr NW Unit M3 73
- 9866 Walkers Glen Dr NW
- 9866 Walkers Glen Dr NW Unit M3 76
- 9882 Walkers Glen Dr NW Unit M3 72
- 9882 Walkers Glen Dr NW
- 1250 Moss Farms Rd NW
- 9886 Walkers Glen Dr NW Unit M3 71
- 9886 Walkers Glen Dr NW
- 9858 Walkers Glen Dr NW
- 9858 Walkers Glen Dr NW Unit M3 78
- 9862 Walkers Glen Dr NW Unit M3 77
- 9890 Walkers Glen Dr NW Unit M3 70
- 9890 Walkers Glen Dr NW
- 1306 Amber Ridge Rd NW
- 1306 Amber Ridge Rd NW Unit 112