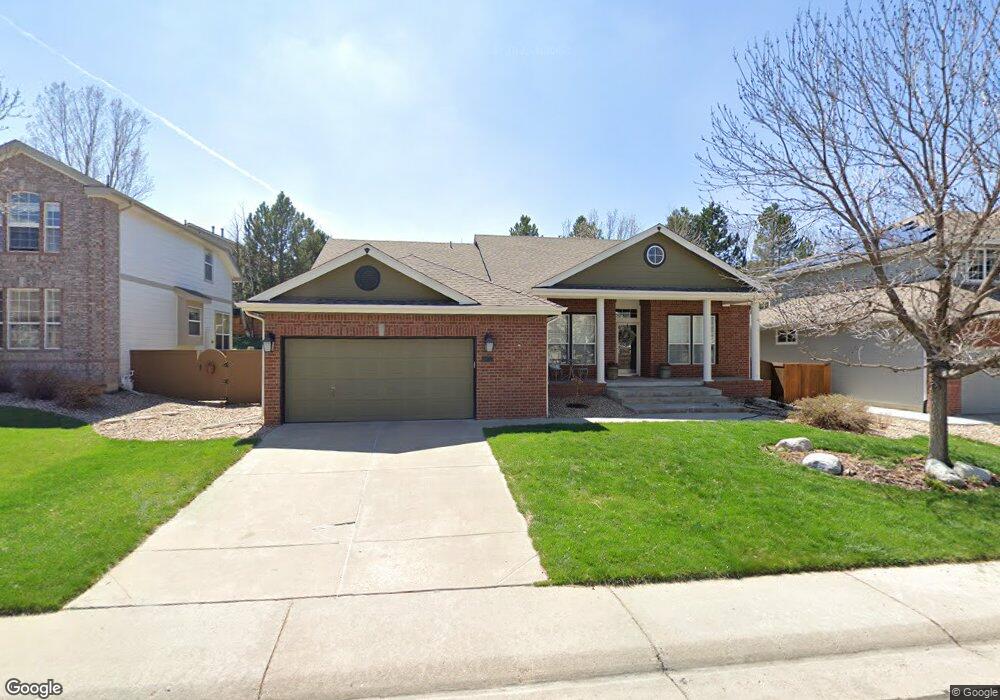
9875 Keenan St Highlands Ranch, CO 80130
Eastridge NeighborhoodEstimated Value: $740,128 - $872,000
3
Beds
2
Baths
3,136
Sq Ft
$258/Sq Ft
Est. Value
About This Home
This home is located at 9875 Keenan St, Highlands Ranch, CO 80130 and is currently estimated at $809,782, approximately $258 per square foot. 9875 Keenan St is a home located in Douglas County with nearby schools including Redstone Elementary School, Rocky Heights Middle School, and Rock Canyon High School.
Ownership History
Date
Name
Owned For
Owner Type
Purchase Details
Closed on
May 27, 2025
Sold by
Steven L Axon Revocable Living Trust and Virginia Lee Bengtson Trust
Bought by
Axon Steven L and Axon Virginia L
Current Estimated Value
Purchase Details
Closed on
Jan 12, 2021
Sold by
Axon Steven and Axon Virginia L
Bought by
Steven L Axon Revocable Living Trust
Purchase Details
Closed on
Sep 20, 2019
Sold by
Axon Steven L and Axon Virginia L
Bought by
Axon Steven and Axon Virginia L
Home Financials for this Owner
Home Financials are based on the most recent Mortgage that was taken out on this home.
Original Mortgage
$409,500
Interest Rate
3.5%
Mortgage Type
New Conventional
Purchase Details
Closed on
Jan 5, 2015
Sold by
Lee Axon Steven and Lee Axon Virginia
Bought by
Steven L Axon Revocable Living Trust
Purchase Details
Closed on
Jun 17, 2013
Sold by
Wiltin Brian A and Luebcke Wiltin Karen
Bought by
Axon Virginia Lee and Axon Steven Lee
Home Financials for this Owner
Home Financials are based on the most recent Mortgage that was taken out on this home.
Original Mortgage
$360,000
Interest Rate
3.43%
Mortgage Type
New Conventional
Purchase Details
Closed on
Feb 2, 2012
Sold by
Luebcke Karen
Bought by
Wiltin Karen Luebcke and Wiltin Brian A
Home Financials for this Owner
Home Financials are based on the most recent Mortgage that was taken out on this home.
Original Mortgage
$320,000
Interest Rate
4%
Mortgage Type
New Conventional
Purchase Details
Closed on
Jun 20, 2008
Sold by
The James G & Bonnie A Merriman Trust
Bought by
Luebcke Karen
Home Financials for this Owner
Home Financials are based on the most recent Mortgage that was taken out on this home.
Original Mortgage
$306,000
Interest Rate
6.42%
Mortgage Type
Unknown
Purchase Details
Closed on
Sep 8, 2004
Sold by
Merriman James Glen and Merriman Bonnie Arlene
Bought by
James G & Bonnie A Merriman Trust
Purchase Details
Closed on
Mar 31, 1998
Sold by
Weekley Homes Lp
Bought by
Fleet Mark R and Fleet Caroline G
Home Financials for this Owner
Home Financials are based on the most recent Mortgage that was taken out on this home.
Original Mortgage
$185,450
Interest Rate
7.21%
Purchase Details
Closed on
Nov 20, 1996
Sold by
Weekley Homes Inc Aka Weekley Homes Lp
Bought by
Weekley Homes Inc Aka Weekley Homes Lp
Purchase Details
Closed on
Oct 18, 1996
Sold by
Mission Viejo Co
Bought by
Weekley Homes Inc
Create a Home Valuation Report for This Property
The Home Valuation Report is an in-depth analysis detailing your home's value as well as a comparison with similar homes in the area
Home Values in the Area
Average Home Value in this Area
Purchase History
| Date | Buyer | Sale Price | Title Company |
|---|---|---|---|
| Axon Steven L | -- | None Listed On Document | |
| Steven L Axon Revocable Living Trust | -- | Land Title Guarantee Co | |
| Axon Steven | -- | Land Title Guarantee Co | |
| Steven L Axon Revocable Living Trust | -- | None Available | |
| Axon Virginia Lee | $465,000 | Guardian Title | |
| Wiltin Karen Luebcke | -- | None Available | |
| Luebcke Karen | $382,500 | Guardian Title | |
| James G & Bonnie A Merriman Trust | -- | Land Title | |
| Merriman James Glen | $355,250 | Land Title | |
| Fleet Mark R | $231,827 | Stewart Title | |
| Weekley Homes Inc Aka Weekley Homes Lp | -- | -- | |
| Weekley Homes Inc | $111,600 | -- |
Source: Public Records
Mortgage History
| Date | Status | Borrower | Loan Amount |
|---|---|---|---|
| Previous Owner | Axon Steven | $409,500 | |
| Previous Owner | Axon Virginia Lee | $360,000 | |
| Previous Owner | Wiltin Karen Luebcke | $320,000 | |
| Previous Owner | Luebcke Karen | $306,000 | |
| Previous Owner | Fleet Mark R | $185,450 |
Source: Public Records
Tax History Compared to Growth
Tax History
| Year | Tax Paid | Tax Assessment Tax Assessment Total Assessment is a certain percentage of the fair market value that is determined by local assessors to be the total taxable value of land and additions on the property. | Land | Improvement |
|---|---|---|---|---|
| 2024 | $4,757 | $54,150 | $12,600 | $41,550 |
| 2023 | $4,748 | $54,150 | $12,600 | $41,550 |
| 2022 | $3,670 | $40,170 | $9,170 | $31,000 |
| 2021 | $3,817 | $40,170 | $9,170 | $31,000 |
| 2020 | $3,463 | $37,340 | $8,380 | $28,960 |
| 2019 | $3,476 | $37,340 | $8,380 | $28,960 |
| 2018 | $3,336 | $35,300 | $8,030 | $27,270 |
| 2017 | $3,038 | $35,300 | $8,030 | $27,270 |
| 2016 | $2,971 | $33,890 | $7,840 | $26,050 |
| 2015 | $3,035 | $33,890 | $7,840 | $26,050 |
| 2014 | $2,835 | $29,230 | $7,320 | $21,910 |
Source: Public Records
Map
Nearby Homes
- 9720 Sydney Ln
- 9735 Queenscliffe Dr
- 10278 Dan Ct
- 10078 Apollo Bay Way
- 5632 Tory Pointe
- 10292 Nickolas Ave
- 4925 Kingston Ave
- 6717 Millstone St
- 10296 Lauren Ct
- 9888 Falcon Creek Dr
- 6109 Trailhead Rd
- 6141 Trailhead Rd
- 6239 Trailhead Rd
- 10439 Cheetah Winds
- 10445 Cheetah Winds
- 9495 Morning Glory Way
- 4907 Fenwood Dr
- 10330 Lions Path
- 4758 Adelaide Place
- 9682 Hemlock Ct
- 9865 Keenan St
- 9885 Keenan St
- 5773 Glenstone Dr
- 5767 Glenstone Dr
- 9855 Keenan St
- 9895 Keenan St
- 5779 Glenstone Dr
- 9876 Keenan St
- 9866 Keenan St
- 5761 Glenstone Dr
- 9886 Keenan St
- 9845 Keenan St
- 5785 Glenstone Dr
- 9905 Keenan St
- 9896 Keenan St
- 9846 Keenan St
- 5755 Glenstone Dr
- 5778 Glenstone Dr
- 9887 Arthur Ln
- 9915 Keenan St