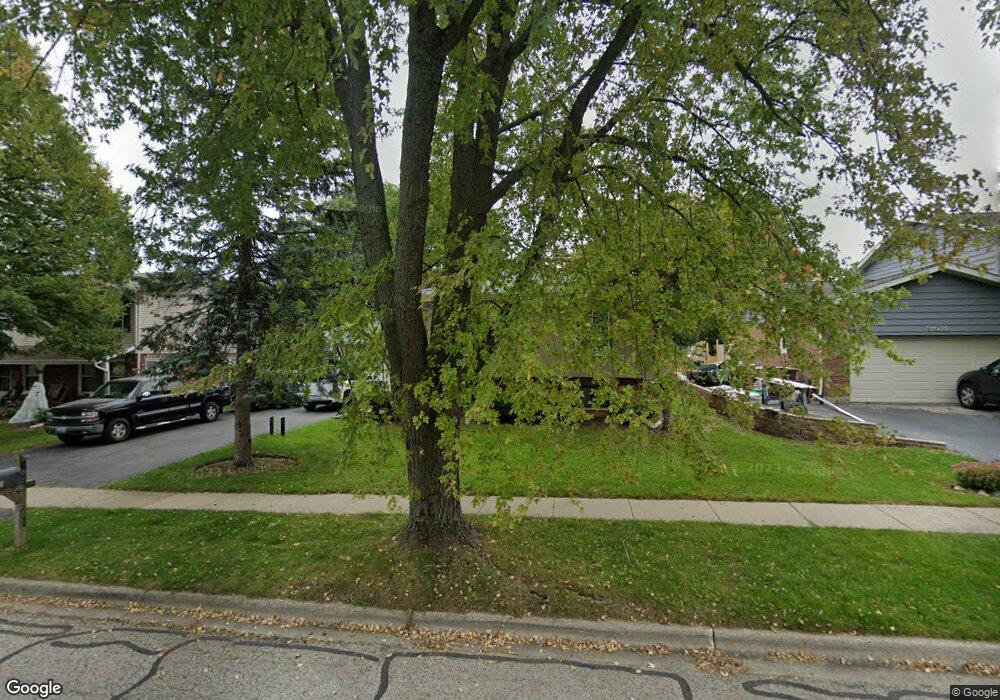
988 Saint Johns Rd Unit 2 Woodstock, IL 60098
Estimated Value: $285,000 - $333,773
4
Beds
2
Baths
1,325
Sq Ft
$240/Sq Ft
Est. Value
About This Home
This home is located at 988 Saint Johns Rd Unit 2, Woodstock, IL 60098 and is currently estimated at $317,943, approximately $239 per square foot. 988 Saint Johns Rd Unit 2 is a home located in McHenry County with nearby schools including Mary Endres Elementary School, Northwood Middle School, and Woodstock North High School.
Ownership History
Date
Name
Owned For
Owner Type
Purchase Details
Closed on
Jul 14, 2017
Sold by
Lee Tamara A
Bought by
Tapia Jose F
Current Estimated Value
Home Financials for this Owner
Home Financials are based on the most recent Mortgage that was taken out on this home.
Original Mortgage
$157,102
Outstanding Balance
$130,020
Interest Rate
3.75%
Mortgage Type
FHA
Estimated Equity
$187,923
Purchase Details
Closed on
Jun 24, 2011
Sold by
Zinnen John D and Zinnen Tami J
Bought by
Lee Tamara A
Home Financials for this Owner
Home Financials are based on the most recent Mortgage that was taken out on this home.
Original Mortgage
$154,950
Interest Rate
4.56%
Mortgage Type
VA
Purchase Details
Closed on
May 21, 2004
Sold by
Cook Cary L and Cook Dawn R
Bought by
Zinnen John D and Zinnen Tami J
Home Financials for this Owner
Home Financials are based on the most recent Mortgage that was taken out on this home.
Original Mortgage
$163,200
Interest Rate
5.85%
Mortgage Type
Purchase Money Mortgage
Create a Home Valuation Report for This Property
The Home Valuation Report is an in-depth analysis detailing your home's value as well as a comparison with similar homes in the area
Home Values in the Area
Average Home Value in this Area
Purchase History
| Date | Buyer | Sale Price | Title Company |
|---|---|---|---|
| Tapia Jose F | $160,000 | Chicago Title | |
| Lee Tamara A | $150,000 | Fidelity Natl Title | |
| Zinnen John D | $204,000 | Universal Title Services Inc |
Source: Public Records
Mortgage History
| Date | Status | Borrower | Loan Amount |
|---|---|---|---|
| Open | Tapia Jose F | $157,102 | |
| Previous Owner | Lee Tamara A | $154,950 | |
| Previous Owner | Zinnen John D | $163,200 |
Source: Public Records
Tax History Compared to Growth
Tax History
| Year | Tax Paid | Tax Assessment Tax Assessment Total Assessment is a certain percentage of the fair market value that is determined by local assessors to be the total taxable value of land and additions on the property. | Land | Improvement |
|---|---|---|---|---|
| 2024 | $8,536 | $99,755 | $17,548 | $82,207 |
| 2023 | $8,226 | $91,226 | $16,048 | $75,178 |
| 2022 | $5,880 | $62,349 | $14,420 | $47,929 |
| 2021 | $5,561 | $58,009 | $13,416 | $44,593 |
| 2020 | $5,335 | $55,000 | $12,720 | $42,280 |
| 2019 | $5,670 | $56,842 | $11,976 | $44,866 |
| 2018 | $5,368 | $53,328 | $11,236 | $42,092 |
| 2017 | $5,857 | $55,172 | $10,545 | $44,627 |
| 2016 | $5,881 | $51,795 | $9,900 | $41,895 |
| 2013 | -- | $51,314 | $9,808 | $41,506 |
Source: Public Records
Map
Nearby Homes
- 1401 Rhett Place
- 1721 Yasgur Dr
- 1819 Woodside Dr
- 214 Raffel Rd
- 1808 Powers Rd
- 1530 Hickory Rd Unit A
- 109 Raffel Rd
- 908 Hickory Rd
- 905 Hickory Rd
- 871 Hickman Ln
- 105 Terry Ct
- 709 Mchenry Ave
- 603 Handel Ln
- 631 Mchenry Ave
- Lt 13 Flagg Ln
- Lt 8 Flagg Ln
- Lt 7 Flagg Ln
- Newport - Two-story Plan at Fairview Estates
- Madison - Two-story Plan at Fairview Estates
- Jefferson - Two-story Plan at Fairview Estates
- 1008 Saint Johns Rd
- 968 Saint Johns Rd
- 1621 Woodside Ct
- 948 Saint Johns Rd
- 1028 Saint Johns Rd
- 977 St Johns Rd
- 1611 Woodside Ct
- 838 Twelve Oaks Pkwy Unit K
- 977 Saint Johns Rd
- 938 Saint Johns Rd
- 1017 Saint Johns Rd
- 937 Saint Johns Rd
- 834 Twelve Oaks Pkwy
- 832 Twelve Oaks Pkwy
- 928 Saint Johns Rd
- 1677 Woodside Ct
- 917 Saint Johns Rd
- 1526 Scarlett Way Unit 1526
- 1524 Scarlett Way Unit 1524
- 1528 Scarlett Way Unit 1528