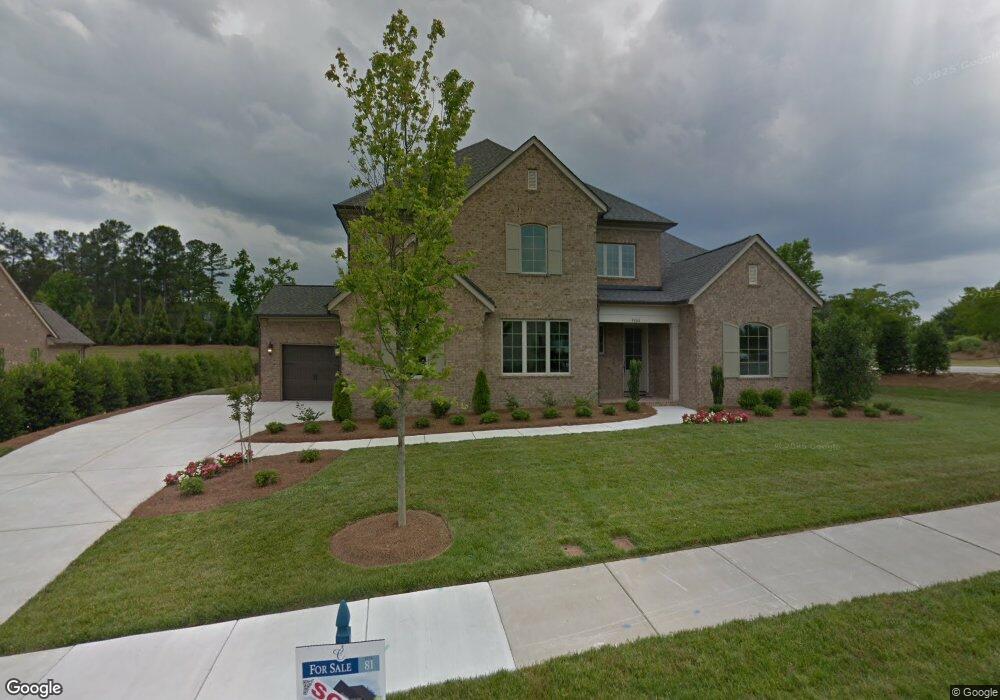
9884 Manor View Dr NW Unit Lot 81 Concord, NC 28027
Estimated Value: $712,000 - $962,802
4
Beds
4
Baths
3,912
Sq Ft
$219/Sq Ft
Est. Value
About This Home
This home is located at 9884 Manor View Dr NW Unit Lot 81, Concord, NC 28027 and is currently estimated at $857,934, approximately $219 per square foot. 9884 Manor View Dr NW Unit Lot 81 is a home located in Cabarrus County with nearby schools including Cox Mill Elementary School, Harold E. Winkler Middle School, and Cox Mill High School.
Ownership History
Date
Name
Owned For
Owner Type
Purchase Details
Closed on
Sep 12, 2022
Sold by
Regmi Suman R and Regmi Suima
Bought by
Regmi Suman Raj and Aryal Suima
Current Estimated Value
Purchase Details
Closed on
Jul 16, 2015
Sold by
Classica Homes Llc
Bought by
Regmi Suman R and Aryal Suima
Home Financials for this Owner
Home Financials are based on the most recent Mortgage that was taken out on this home.
Original Mortgage
$375,900
Interest Rate
4.08%
Mortgage Type
New Conventional
Purchase Details
Closed on
Jul 9, 2014
Sold by
Christenbury Land Investments Llc
Bought by
Classica Homes Llc
Home Financials for this Owner
Home Financials are based on the most recent Mortgage that was taken out on this home.
Original Mortgage
$432,000
Interest Rate
4.17%
Mortgage Type
Construction
Create a Home Valuation Report for This Property
The Home Valuation Report is an in-depth analysis detailing your home's value as well as a comparison with similar homes in the area
Home Values in the Area
Average Home Value in this Area
Purchase History
| Date | Buyer | Sale Price | Title Company |
|---|---|---|---|
| Regmi Suman Raj | -- | -- | |
| Regmi Suman R | $580,000 | None Available | |
| Classica Homes Llc | $92,000 | None Available |
Source: Public Records
Mortgage History
| Date | Status | Borrower | Loan Amount |
|---|---|---|---|
| Previous Owner | Regmi Suman R | $375,900 | |
| Previous Owner | Classica Homes Llc | $432,000 |
Source: Public Records
Tax History Compared to Growth
Tax History
| Year | Tax Paid | Tax Assessment Tax Assessment Total Assessment is a certain percentage of the fair market value that is determined by local assessors to be the total taxable value of land and additions on the property. | Land | Improvement |
|---|---|---|---|---|
| 2025 | $8,068 | $810,080 | $186,000 | $624,080 |
| 2024 | $8,068 | $810,080 | $186,000 | $624,080 |
| 2023 | $7,004 | $574,080 | $122,000 | $452,080 |
| 2022 | $7,004 | $574,080 | $122,000 | $452,080 |
| 2021 | $7,004 | $574,080 | $122,000 | $452,080 |
| 2020 | $7,004 | $574,080 | $122,000 | $452,080 |
| 2019 | $6,507 | $533,340 | $105,000 | $428,340 |
| 2018 | $6,400 | $533,340 | $105,000 | $428,340 |
| 2017 | $6,293 | $533,340 | $105,000 | $428,340 |
| 2016 | $3,733 | $281,080 | $60,000 | $221,080 |
| 2015 | -- | $60,000 | $60,000 | $0 |
| 2014 | -- | $60,000 | $60,000 | $0 |
Source: Public Records
Map
Nearby Homes
- 2414 Riders Glen Ct
- 2277 Elendil Ln
- 3930 Kalispell Ln
- 2904 Autumn Harvest Ln
- 2413 Orofino Ct
- 2422 Orofino Ct
- 2111 Elendil Ln
- 2419 Orofino Ct
- 2506 Susie Brumley Place NW
- 2013 Solway Ln
- 2377 Maple Grove Ln NW
- 2055 Solway Ln
- 3214 Grandeur Rd
- 2346 Donnington Ln NW
- 7828 Dunoon Ln
- 10015 Legolas Ln
- 9595 Ledbury Ct NW
- 10004 Legolas Ln
- 3155 Golden Dale Ln
- 8440 Carolina Lily Ln
- 9874 Christenbury Pkwy
- 9888 Manor View Dr NW
- 2414 Summers Glen Dr NW
- 9892 Manor View Dr NW Unit 83
- 9893 Manor View Dr NW
- 9890 Christenbury Pkwy
- 2418 Summers Glen Dr NW
- 9896 Manor View Dr NW
- 9899 Manor View Dr NW Unit 97
- 2422 Summers Glen Dr NW Unit 101
- 9920 Dominion Crest Dr
- 9903 Manor View Dr NW
- 2418 Riders Glen Ct
- 2281 Elendil Ln
- 9924 Dominion Crest Dr
- 2426 Summers Glen Dr NW Unit 102
- 2426 Summers Glen Dr NW
- 9903 Dominion Crest Dr
- 2283 Elendil Ln
- 2273 Elendil Ln