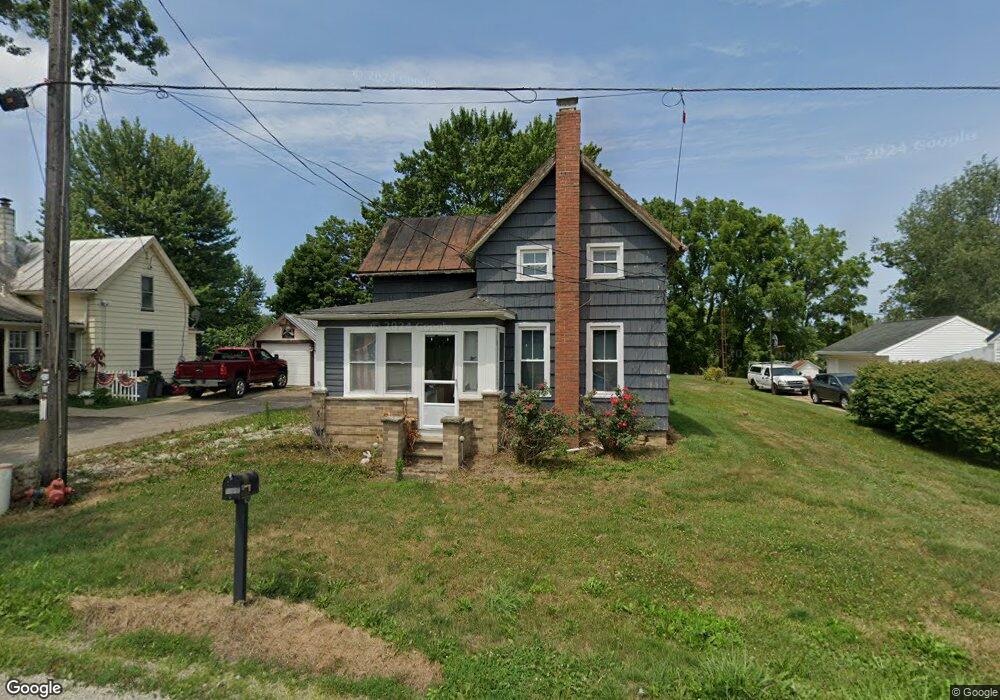
9885 Hiner Rd Wooster, OH 44691
Estimated Value: $59,493 - $149,000
3
Beds
1
Bath
953
Sq Ft
$107/Sq Ft
Est. Value
About This Home
This home is located at 9885 Hiner Rd, Wooster, OH 44691 and is currently estimated at $102,373, approximately $107 per square foot. 9885 Hiner Rd is a home located in Wayne County with nearby schools including Northwestern Elementary School, Northwestern Middle School, and Northwestern High School.
Ownership History
Date
Name
Owned For
Owner Type
Purchase Details
Closed on
Feb 11, 2022
Sold by
Jeffery Price
Bought by
Garver Kelly
Current Estimated Value
Purchase Details
Closed on
Feb 10, 2021
Sold by
Price Jeff
Bought by
Jeff Price
Purchase Details
Closed on
Nov 7, 2016
Sold by
Price Paul E and Price Shirley F
Bought by
Price Jeff
Purchase Details
Closed on
Nov 27, 1996
Sold by
Lawrence Ada J
Bought by
Paul and Price Shirley F
Home Financials for this Owner
Home Financials are based on the most recent Mortgage that was taken out on this home.
Original Mortgage
$40,250
Interest Rate
7.94%
Mortgage Type
New Conventional
Purchase Details
Closed on
Jun 30, 1994
Sold by
Lawrence Ada J
Bought by
Norris Wayne L and Norris Vicki B
Purchase Details
Closed on
Jun 18, 1991
Sold by
Lawrence Howard J
Bought by
Lawrence Ada J
Create a Home Valuation Report for This Property
The Home Valuation Report is an in-depth analysis detailing your home's value as well as a comparison with similar homes in the area
Home Values in the Area
Average Home Value in this Area
Purchase History
| Date | Buyer | Sale Price | Title Company |
|---|---|---|---|
| Garver Kelly | $80,000 | Normand Alexis C | |
| Garver Kelly | $40,000 | Normand Alexis C | |
| Garver Kelly | $40,000 | None Listed On Document | |
| Jeff Price | -- | -- | |
| Price Jeff | -- | None Available | |
| Paul | $57,500 | -- | |
| Norris Wayne L | $54,000 | -- | |
| Lawrence Ada J | -- | -- |
Source: Public Records
Mortgage History
| Date | Status | Borrower | Loan Amount |
|---|---|---|---|
| Previous Owner | Paul | $40,250 |
Source: Public Records
Tax History Compared to Growth
Tax History
| Year | Tax Paid | Tax Assessment Tax Assessment Total Assessment is a certain percentage of the fair market value that is determined by local assessors to be the total taxable value of land and additions on the property. | Land | Improvement |
|---|---|---|---|---|
| 2024 | $525 | $13,990 | $6,310 | $7,680 |
| 2023 | $500 | $13,990 | $6,310 | $7,680 |
| 2022 | $686 | $17,370 | $5,010 | $12,360 |
| 2021 | $687 | $17,370 | $5,010 | $12,360 |
| 2020 | $690 | $17,230 | $4,870 | $12,360 |
| 2019 | $661 | $15,490 | $3,570 | $11,920 |
| 2018 | $647 | $15,490 | $3,570 | $11,920 |
| 2017 | $642 | $15,490 | $3,570 | $11,920 |
| 2016 | $580 | $14,400 | $3,570 | $10,830 |
| 2015 | $572 | $14,400 | $3,570 | $10,830 |
| 2014 | $579 | $14,400 | $3,570 | $10,830 |
| 2013 | $597 | $14,330 | $3,460 | $10,870 |
Source: Public Records
Map
Nearby Homes
- 9869 Hiner Rd
- 9895 Hiner Rd
- 9857 Hiner Rd
- 9841 Hiner Rd
- 9925 Hiner Rd
- 9813 Hiner Rd
- 9939 Hiner Rd
- 9814 Ashland Rd
- 9777 Hiner Rd
- 9778 Hiner Rd
- 9804 Ashland Rd
- 9816 Ashland Rd
- 9862 Ashland Rd
- 9732 Ashland Rd
- 9732 Ashland Rd
- 9702 Ashland Rd
- 9840 Ashland Rd
- 9793 Ashland Rd
- 9793 Ashland Rd
- 9747 Ashland Rd