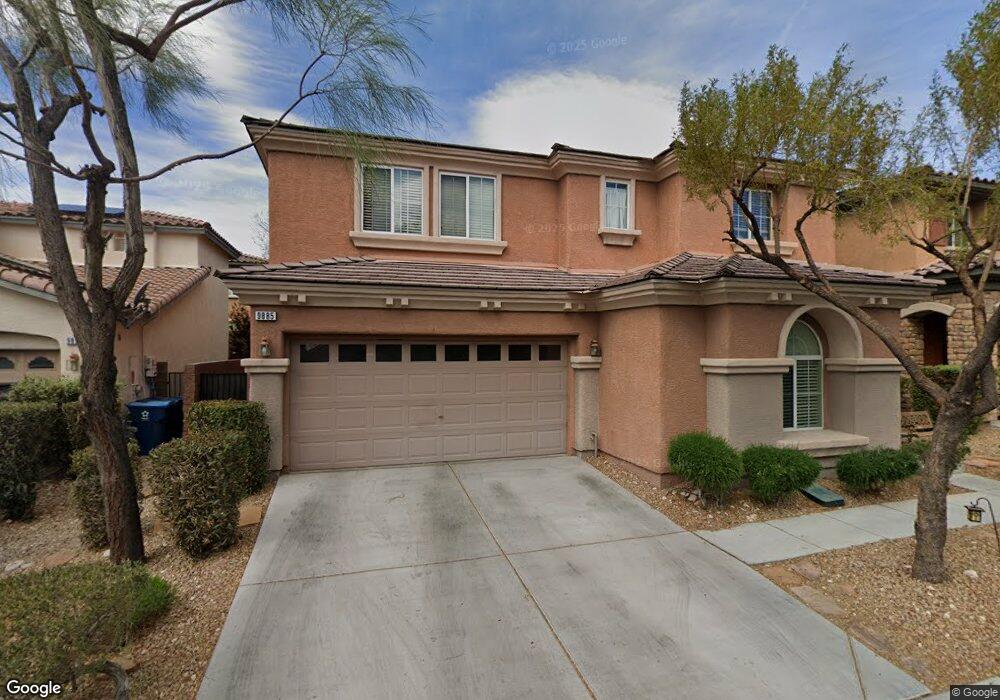
9885 Mount Oroville Ct Las Vegas, NV 89178
Mountains Edge NeighborhoodEstimated Value: $497,000 - $560,000
4
Beds
3
Baths
2,631
Sq Ft
$201/Sq Ft
Est. Value
About This Home
This home is located at 9885 Mount Oroville Ct, Las Vegas, NV 89178 and is currently estimated at $528,385, approximately $200 per square foot. 9885 Mount Oroville Ct is a home located in Clark County with nearby schools including William V. Wright Elementary School, Desert Oasis High School, and Doral Academy Cactus.
Ownership History
Date
Name
Owned For
Owner Type
Purchase Details
Closed on
Sep 3, 2014
Sold by
Blazi Jeff
Bought by
Blazi Iris I
Current Estimated Value
Home Financials for this Owner
Home Financials are based on the most recent Mortgage that was taken out on this home.
Original Mortgage
$259,500
Outstanding Balance
$198,370
Interest Rate
4.1%
Mortgage Type
New Conventional
Estimated Equity
$330,015
Purchase Details
Closed on
Sep 18, 2006
Sold by
Villaranda Iris and Villaranda Cicero
Bought by
Villaranda Iris and Villaranda Cicero
Purchase Details
Closed on
Jun 14, 2006
Sold by
Villaranda Lucita
Bought by
Villaranda Cicero
Home Financials for this Owner
Home Financials are based on the most recent Mortgage that was taken out on this home.
Original Mortgage
$318,260
Interest Rate
6.19%
Mortgage Type
Unknown
Create a Home Valuation Report for This Property
The Home Valuation Report is an in-depth analysis detailing your home's value as well as a comparison with similar homes in the area
Home Values in the Area
Average Home Value in this Area
Purchase History
| Date | Buyer | Sale Price | Title Company |
|---|---|---|---|
| Blazi Iris I | -- | Ticor Title Las Vegas | |
| Blazi Iris I | -- | Ticor Title Las Vegas | |
| Villaranda Iris | -- | None Available | |
| Villaranda Cicero | -- | Chicago Title | |
| Villaranda Iris | $397,826 | Chicago Title |
Source: Public Records
Mortgage History
| Date | Status | Borrower | Loan Amount |
|---|---|---|---|
| Open | Blazi Iris I | $259,500 | |
| Closed | Villaranda Iris | $318,260 |
Source: Public Records
Tax History Compared to Growth
Tax History
| Year | Tax Paid | Tax Assessment Tax Assessment Total Assessment is a certain percentage of the fair market value that is determined by local assessors to be the total taxable value of land and additions on the property. | Land | Improvement |
|---|---|---|---|---|
| 2025 | $2,344 | $147,643 | $36,750 | $110,893 |
| 2024 | $2,276 | $147,643 | $36,750 | $110,893 |
| 2023 | $2,276 | $139,673 | $35,000 | $104,673 |
| 2022 | $2,210 | $123,266 | $28,000 | $95,266 |
| 2021 | $2,243 | $116,695 | $26,250 | $90,445 |
| 2020 | $2,080 | $116,742 | $27,300 | $89,442 |
| 2019 | $1,950 | $110,924 | $23,100 | $87,824 |
| 2018 | $1,860 | $102,884 | $18,900 | $83,984 |
| 2017 | $1,742 | $97,781 | $17,850 | $79,931 |
| 2016 | $1,742 | $81,755 | $14,000 | $67,755 |
| 2015 | $1,738 | $75,238 | $11,900 | $63,338 |
| 2014 | $1,687 | $55,814 | $7,000 | $48,814 |
Source: Public Records
Map
Nearby Homes
- 8733 Autumn Teal Ave
- 8626 Anderson Dale Ave
- 8719 Mount Mira Loma Ave
- 9864 Maspalomas St
- 8823 Autumn Teal Ave
- 8547 Benidorm Ave
- 8695 Canfield Canyon Ave
- 7680 Pirouette Ave
- 7711 Pirouette Ave
- 7651 Pirouette Ave
- 7661 Pirouette Ave
- 7671 Pirouette Ave
- 7690 Pirouette Ave
- 8968 Horizon Hyatt Ave
- 8396 Waylon Ave
- 9539 Iris Flat Ct
- 9738 Elk Grove Valley St
- 10208 Arch Bluff St
- 8749 Brilliant Star Dr
- 9715 Aleutian St
- 9873 Mount Oroville Ct
- 9897 Mount Oroville Ct
- 9884 Mount Madera St
- 9896 Mount Madera St
- 9872 Mount Madera St Unit 1
- 9861 Mount Oroville Ct
- 9886 Mount Oroville Ct
- 9860 Mount Madera St
- 9874 Mount Oroville Ct
- 9898 Mount Oroville Ct
- 9849 Mount Oroville Ct Unit 1
- 9862 Mount Oroville Ct
- 9848 Mount Madera St
- 9905 Saint Season St
- 9850 Mount Oroville Ct
- 8686 Anderson Dale Ave
- 9875 Dublin Valley St
- 9883 Mount Madera St
- 9837 Mount Oroville Ct
- 9871 Mount Madera St