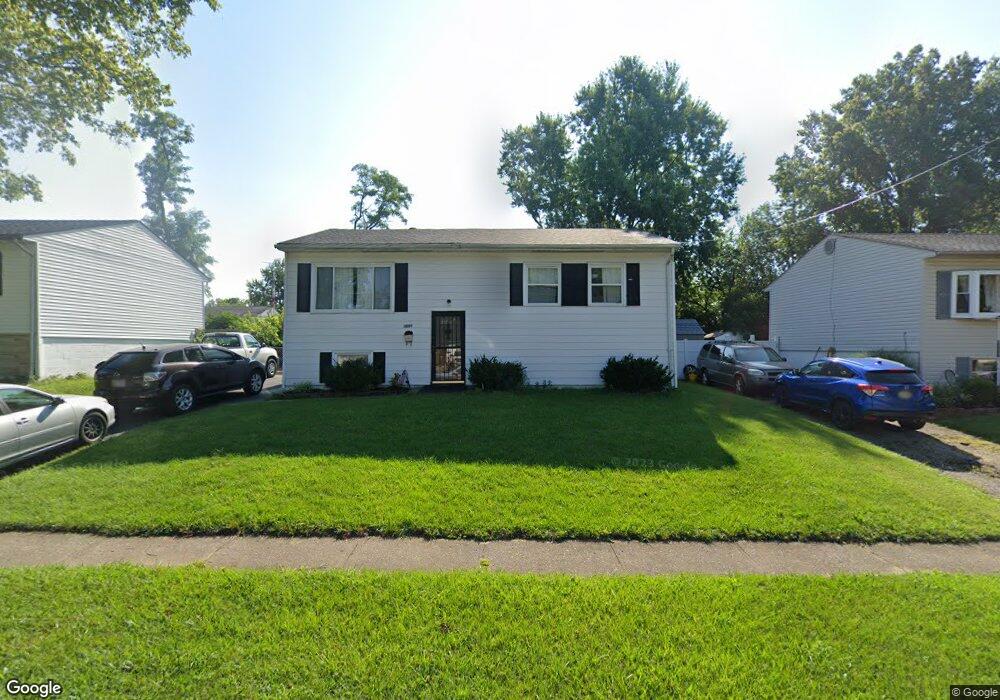
9886 Crusader Dr Cincinnati, OH 45251
Estimated Value: $123,000 - $203,000
3
Beds
1
Bath
1,872
Sq Ft
$96/Sq Ft
Est. Value
About This Home
This home is located at 9886 Crusader Dr, Cincinnati, OH 45251 and is currently estimated at $180,157, approximately $96 per square foot. 9886 Crusader Dr is a home located in Hamilton County with nearby schools including Taylor Elementary School, Pleasant Run Elementary School, and Pleasant Run Middle School.
Ownership History
Date
Name
Owned For
Owner Type
Purchase Details
Closed on
Apr 4, 2008
Sold by
Hud
Bought by
Zegeye Yohannes K and Tsegaye Sophia E
Current Estimated Value
Home Financials for this Owner
Home Financials are based on the most recent Mortgage that was taken out on this home.
Original Mortgage
$46,690
Outstanding Balance
$29,883
Interest Rate
6.17%
Mortgage Type
FHA
Estimated Equity
$150,274
Purchase Details
Closed on
Nov 22, 2002
Sold by
Stanton Charles R
Bought by
Overton Donna J
Home Financials for this Owner
Home Financials are based on the most recent Mortgage that was taken out on this home.
Original Mortgage
$96,622
Outstanding Balance
$40,441
Interest Rate
6.01%
Mortgage Type
FHA
Estimated Equity
$139,716
Create a Home Valuation Report for This Property
The Home Valuation Report is an in-depth analysis detailing your home's value as well as a comparison with similar homes in the area
Home Values in the Area
Average Home Value in this Area
Purchase History
| Date | Buyer | Sale Price | Title Company |
|---|---|---|---|
| Zegeye Yohannes K | -- | Lakeside Title & Escrow Agen | |
| Overton Donna J | $98,000 | -- |
Source: Public Records
Mortgage History
| Date | Status | Borrower | Loan Amount |
|---|---|---|---|
| Open | Zegeye Yohannes K | $46,690 | |
| Open | Overton Donna J | $96,622 |
Source: Public Records
Tax History Compared to Growth
Tax History
| Year | Tax Paid | Tax Assessment Tax Assessment Total Assessment is a certain percentage of the fair market value that is determined by local assessors to be the total taxable value of land and additions on the property. | Land | Improvement |
|---|---|---|---|---|
| 2024 | $2,544 | $47,065 | $8,789 | $38,276 |
| 2023 | $2,558 | $47,065 | $8,789 | $38,276 |
| 2022 | $2,142 | $32,092 | $7,753 | $24,339 |
| 2021 | $2,124 | $32,092 | $7,753 | $24,339 |
| 2020 | $2,146 | $32,092 | $7,753 | $24,339 |
| 2019 | $1,859 | $25,879 | $6,251 | $19,628 |
| 2018 | $1,670 | $25,879 | $6,251 | $19,628 |
| 2017 | $1,584 | $25,879 | $6,251 | $19,628 |
| 2016 | $1,764 | $28,504 | $6,307 | $22,197 |
| 2015 | $1,781 | $28,504 | $6,307 | $22,197 |
| 2014 | $1,784 | $28,504 | $6,307 | $22,197 |
| 2013 | $1,788 | $30,006 | $6,640 | $23,366 |
Source: Public Records
Map
Nearby Homes
- 9974 Marino Dr
- 9977 Dunraven Dr
- 2788 Hazelton Ct
- 9828 Loralinda Dr
- 9738 Gibralter Dr
- 9737 Dunraven Dr
- 9712 Manhattan Dr
- 9717 Loralinda Dr
- 9659 Cedarhurst Dr
- 9648 Cedarhurst Dr
- 2592 Wenning Rd
- 3246 Ainsworth Dr
- 3244 Springdale Rd
- 3276 Deshler Dr
- 9562 Trafalgar Ct
- 3275 Deshler Dr
- 10229 Crestland Ct
- 10226 Springknob Ct
- 10221 Crestland Ct
- 2680 Topeka St
- 9880 Crusader Dr
- 9894 Crusader Dr
- 9900 Crusader Dr
- 9872 Crusader Dr
- 9893 Dunraven Dr
- 9901 Dunraven Dr
- 9885 Dunraven Dr
- 9909 Dunraven Dr
- 9883 Crusader Dr
- 9889 Crusader Dr
- 9908 Crusader Dr
- 9866 Crusader Dr
- 9875 Crusader Dr
- 9897 Crusader Dr
- 9877 Dunraven Dr
- 9917 Dunraven Dr
- 9869 Crusader Dr
- 9905 Crusader Dr
- 9914 Crusader Dr
- 9858 Crusader Dr