989 Allison Ct Nipomo, CA 93444
Woodlands NeighborhoodEstimated Value: $1,317,000 - $1,425,041
About This Home
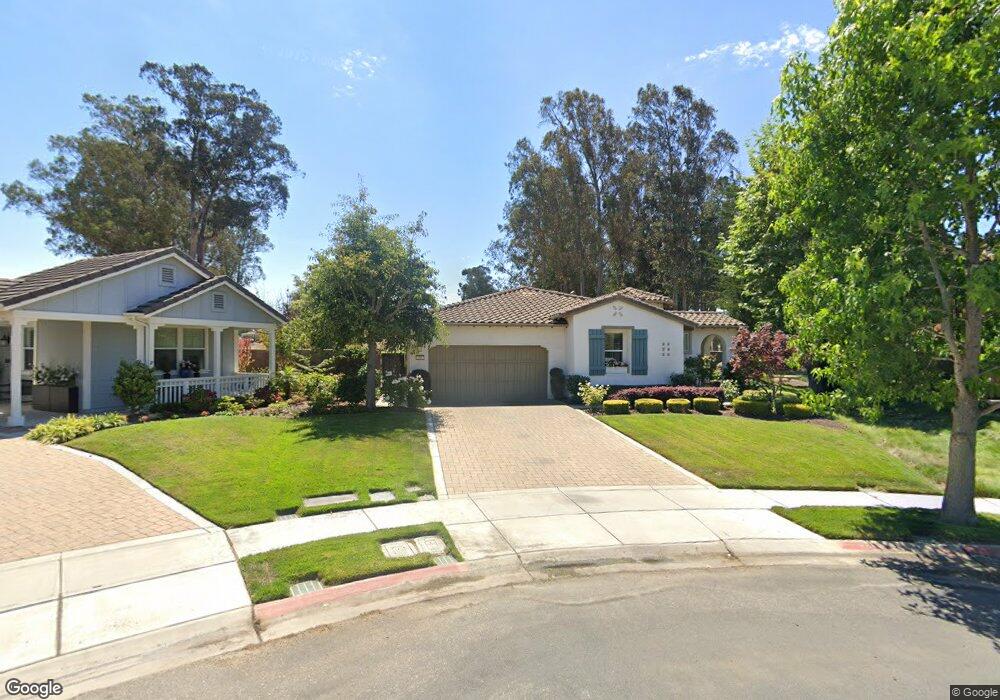
This home is located at 989 Allison Ct, Nipomo, CA 93444 and is currently estimated at $1,368,510, approximately $585 per square foot. 989 Allison Ct is a home located in San Luis Obispo County with nearby schools including Dorothea Lange Elementary School, Mesa Middle School, and Nipomo High School.
Ownership History
We collect this data history from publicly available records. To have your information removed, we recommend requesting removal directly through your county’s website.
Purchase Details
Purchase Details
Home Values in the Area
Average Home Value in this Area
Purchase History
We collect this data history from publicly available records. To have your information removed, we recommend requesting removal directly through your county’s website.
| Date | Buyer | Sale Price | Title Company |
|---|---|---|---|
| -- | None Available | ||
| $777,500 | First American Title Company |
Tax History
We collect this data history from publicly available records. To have your information removed, we recommend requesting removal directly through your county’s website.
| Year | Tax Paid | Tax Assessment Tax Assessment Total Assessment is a certain percentage of the fair market value that is determined by local assessors to be the total taxable value of land and additions on the property. | Land | Improvement |
|---|---|---|---|---|
| 2025 | $10,218 | $1,000,578 | $515,098 | $485,480 |
| 2024 | $10,100 | $980,960 | $504,999 | $475,961 |
| 2023 | $10,100 | $961,727 | $495,098 | $466,629 |
| 2022 | $9,946 | $942,871 | $485,391 | $457,480 |
| 2021 | $9,926 | $924,384 | $475,874 | $448,510 |
| 2020 | $9,812 | $914,907 | $470,995 | $443,912 |
| 2019 | $9,750 | $896,968 | $461,760 | $435,208 |
| 2018 | $9,633 | $879,381 | $452,706 | $426,675 |
| 2017 | $9,451 | $862,139 | $443,830 | $418,309 |
| 2016 | $8,888 | $843,000 | $435,000 | $408,000 |
| 2015 | $8,384 | $795,000 | $410,000 | $385,000 |
| 2014 | $7,785 | $752,000 | $385,000 | $367,000 |
Map
- 926 Miguel Ct
- 924 Miguel Ct
- 1772 Waterview Place
- 957 Jacqueline Place
- 995 Jacqueline Place
- 1672 Trilogy Pkwy
- 1642 Northwood Rd
- 1784 Trilogy Pkwy
- 1958 Eucalyptus Rd
- 955 Guadalupe Rd
- 1176 Spring Azure Way
- 1189 Swallowtail Way
- 1018 Joseph Ct
- 1662 Eucalyptus Rd
- 1650 Eucalyptus Rd
- 808 Albert Way
- 708 Albert Way
- 1390 Coloma Ln
- 1155 Aj Ln
- 1330 Riley Ln
- 973 Allison Ct
- 969 Allison Ct
- 977 Allison Ct
- 965 Allison Ct
- 981 Allison Ct
- 1691 Waterview Place
- 972 Allison Ct
- 968 Allison Ct
- 976 Allison Ct
- 968 Michele Ct
- 985 Allison Ct
- 964 Allison Ct
- 980 Allison Ct
- 972 Michele Ct
- 964 Michele Ct
- 1694 Waterview Place
- 984 Allison Ct
- 1688 Waterview Place
- 1711 Waterview Place
- 1706 Waterview Place
Ask me questions while you tour the home.