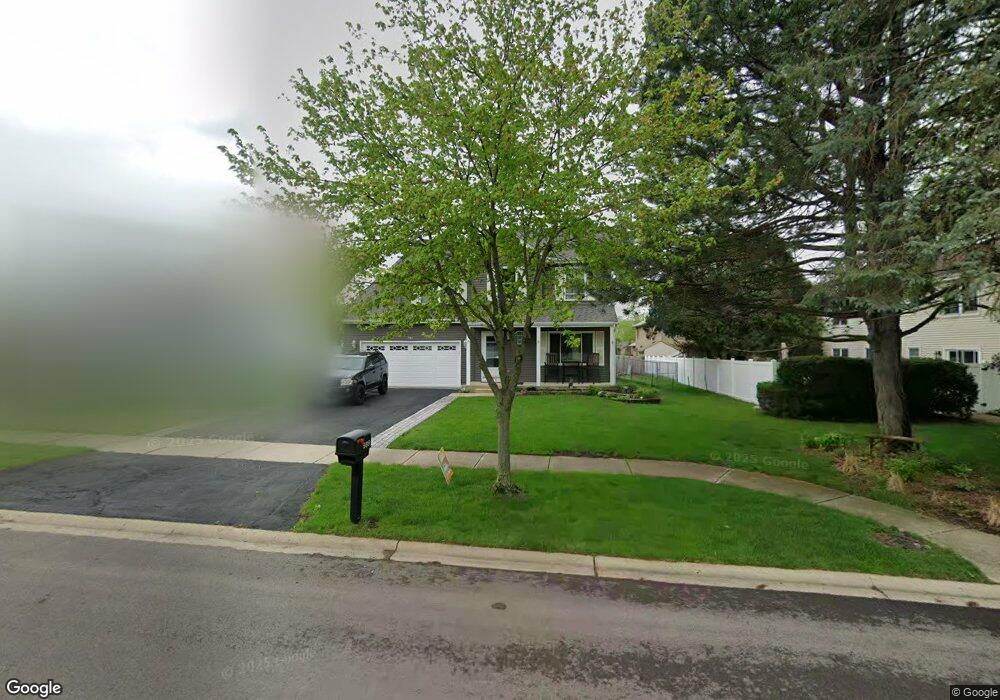
989 Legrande Ave Aurora, IL 60506
Edgelawn Randall NeighborhoodEstimated Value: $375,937 - $394,000
4
Beds
3
Baths
2,000
Sq Ft
$191/Sq Ft
Est. Value
About This Home
This home is located at 989 Legrande Ave, Aurora, IL 60506 and is currently estimated at $382,234, approximately $191 per square foot. 989 Legrande Ave is a home located in Kane County with nearby schools including Smith Elementary School, Jewel Middle School, and West Aurora High School.
Ownership History
Date
Name
Owned For
Owner Type
Purchase Details
Closed on
Aug 29, 2017
Sold by
Hauk Richard L and Hauk Diane M
Bought by
Bjork Lorri
Current Estimated Value
Home Financials for this Owner
Home Financials are based on the most recent Mortgage that was taken out on this home.
Original Mortgage
$204,232
Outstanding Balance
$171,546
Interest Rate
4.12%
Mortgage Type
FHA
Estimated Equity
$210,688
Purchase Details
Closed on
Mar 31, 2005
Sold by
Somhell Timothy L and Somhell Christina M
Bought by
Hauk Richard L and Hauk Diane M
Home Financials for this Owner
Home Financials are based on the most recent Mortgage that was taken out on this home.
Original Mortgage
$172,000
Interest Rate
5.89%
Mortgage Type
Fannie Mae Freddie Mac
Purchase Details
Closed on
Mar 27, 1995
Sold by
Lasalle National Trust Na
Bought by
Somheil Timothy L and Somheil Christina M
Home Financials for this Owner
Home Financials are based on the most recent Mortgage that was taken out on this home.
Original Mortgage
$135,800
Interest Rate
8.25%
Create a Home Valuation Report for This Property
The Home Valuation Report is an in-depth analysis detailing your home's value as well as a comparison with similar homes in the area
Home Values in the Area
Average Home Value in this Area
Purchase History
| Date | Buyer | Sale Price | Title Company |
|---|---|---|---|
| Bjork Lorri | $208,000 | Chicago Title Insurance Co | |
| Hauk Richard L | $215,000 | Chicago Title Insurance Comp | |
| Somheil Timothy L | $143,500 | First American Title Ins Co |
Source: Public Records
Mortgage History
| Date | Status | Borrower | Loan Amount |
|---|---|---|---|
| Open | Bjork Lorri | $204,232 | |
| Previous Owner | Hauk Richard L | $172,000 | |
| Previous Owner | Somheil Timothy L | $135,800 |
Source: Public Records
Tax History
| Year | Tax Paid | Tax Assessment Tax Assessment Total Assessment is a certain percentage of the fair market value that is determined by local assessors to be the total taxable value of land and additions on the property. | Land | Improvement |
|---|---|---|---|---|
| 2024 | $8,303 | $112,857 | $18,563 | $94,294 |
| 2023 | $7,952 | $100,837 | $16,586 | $84,251 |
| 2022 | $7,613 | $92,004 | $15,133 | $76,871 |
| 2021 | $7,278 | $85,657 | $14,089 | $71,568 |
| 2020 | $6,887 | $79,563 | $13,087 | $66,476 |
| 2019 | $6,727 | $74,795 | $12,125 | $62,670 |
| 2018 | $6,213 | $68,231 | $11,215 | $57,016 |
| 2017 | $7,189 | $75,848 | $10,334 | $65,514 |
| 2016 | $6,346 | $65,737 | $8,858 | $56,879 |
| 2015 | -- | $57,101 | $7,617 | $49,484 |
| 2014 | -- | $51,999 | $7,326 | $44,673 |
| 2013 | -- | $54,781 | $7,221 | $47,560 |
Source: Public Records
Map
Nearby Homes
- 1229 Yellowpine Dr
- 833 Sheldon Ave
- 1387 S Glen Cir Unit D
- 1351 Monomoy St Unit D
- 847 Foran Ln
- 833 N Randall Rd Unit C4
- 811 N Randall Rd Unit B
- 1358 Monomoy St Unit A
- 1421 Heather Dr
- 742 N Glenwood Place
- 1039 S Pleasure Ct
- 735 Westgate Dr
- 991 Sapphire Ln
- 959 Sapphire Ln
- 975 Sapphire Ln
- 963 Sapphire Ln
- 987 Sapphire Ln
- 983 Sapphire Ln
- 980 Sapphire Ln
- 968 Sapphire Ln
- 997 Legrande Ave
- 1155 Colorado Ave
- 970 N Commonwealth Ave
- 1005 Legrande Ave
- 980 N Commonwealth Ave
- 1141 Colorado Ave Unit 2
- 990 N Commonwealth Ave
- 992 Legrande Ave
- 1013 Legrande Ave
- 1191 Colorado Ave
- 1210 Cottonwood Dr
- 1000 N Commonwealth Ave
- 1150 Colorado Ave
- 1164 Colorado Ave
- 1021 Legrande Ave
- 1140 Colorado Ave
- 1170 Colorado Ave
- 1010 N Commonwealth Ave
- 1218 Cottonwood Dr
- 1203 Colorado Ave Unit 2
Your Personal Tour Guide
Ask me questions while you tour the home.