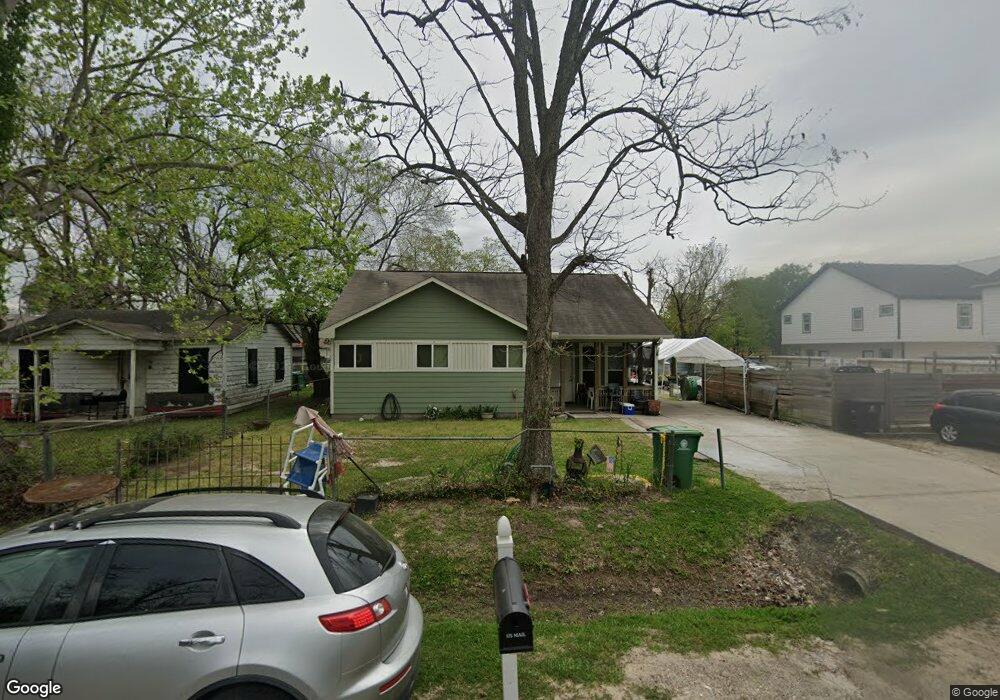
989 Marjorie St Houston, TX 77088
Acres Homes NeighborhoodEstimated Value: $220,357 - $278,000
3
Beds
2
Baths
1,294
Sq Ft
$188/Sq Ft
Est. Value
About This Home
This home is located at 989 Marjorie St, Houston, TX 77088 and is currently estimated at $242,839, approximately $187 per square foot. 989 Marjorie St is a home located in Harris County with nearby schools including Osborne Elementary School, Williams Middle, and Booker T Washington Sr High.
Ownership History
Date
Name
Owned For
Owner Type
Purchase Details
Closed on
Nov 9, 2017
Sold by
Mcclenon Darren
Bought by
Mccflenon Darren
Current Estimated Value
Purchase Details
Closed on
Dec 10, 2008
Sold by
King Barbara and Jones Julia
Bought by
Mclenon Claborn and King Barbara
Purchase Details
Closed on
Mar 23, 1995
Sold by
Simon Allen and Simon Mary
Bought by
Love Jr David
Create a Home Valuation Report for This Property
The Home Valuation Report is an in-depth analysis detailing your home's value as well as a comparison with similar homes in the area
Home Values in the Area
Average Home Value in this Area
Purchase History
| Date | Buyer | Sale Price | Title Company |
|---|---|---|---|
| Mccflenon Darren | -- | None Available | |
| Mclenon Claborn | -- | None Available | |
| Love Jr David | -- | -- |
Source: Public Records
Tax History Compared to Growth
Tax History
| Year | Tax Paid | Tax Assessment Tax Assessment Total Assessment is a certain percentage of the fair market value that is determined by local assessors to be the total taxable value of land and additions on the property. | Land | Improvement |
|---|---|---|---|---|
| 2025 | $217 | $236,571 | $80,509 | $156,062 |
| 2024 | $217 | $224,190 | $80,509 | $143,681 |
| 2023 | $187 | $225,787 | $80,509 | $145,278 |
| 2022 | $2,941 | $190,882 | $62,836 | $128,046 |
| 2021 | $2,830 | $158,304 | $41,236 | $117,068 |
| 2020 | $2,673 | $143,121 | $35,345 | $107,776 |
| 2019 | $2,539 | $140,328 | $31,418 | $108,910 |
| 2018 | $459 | $122,841 | $19,145 | $103,696 |
| 2017 | $2,097 | $82,923 | $12,764 | $70,159 |
| 2016 | $2,097 | $82,923 | $12,764 | $70,159 |
| 2015 | $41 | $35,257 | $12,764 | $22,493 |
| 2014 | $41 | $35,257 | $12,764 | $22,493 |
Source: Public Records
Map
Nearby Homes
- 990 Marjorie St
- 932 S Lane Unit A-B Houston
- 1061 South Ln
- 991 Reverend b j Lewis Dr
- 1031 North Ln
- 1033 North Ln
- 936 - A&B South Ln
- 934 South Ln
- 954A Junell St
- 1030 Reverend b j Lewis Dr
- 0 Prairie View Dr
- 1050 Marjorie St
- 1052 Marjorie St
- 8308 Prairie View Dr
- 1053 Marjorie St
- 8114 Double Unit C/D
- 8114 Double Unit A/B
- 911 Fortune St
- 906 Fortune St
- 8324 Williamsdell St
- 985 Marjorie St
- 981 Marjorie St
- 8132 Knox St
- 997 Marjorie St
- 988 Marjorie St
- 992 Junell St
- 988 Junell St
- 977 Marjorie St
- 8130,8132 Knox
- 999 Marjorie St
- 984 Junell St
- 984 Marjorie St
- 992 Marjorie St
- 976 Junell St
- 980 Marjorie St
- 975 Marjorie St
- 8206 Knox St
- 1001 Marjorie St
- 976 Marjorie St
- 976 Marjorie St Unit 2