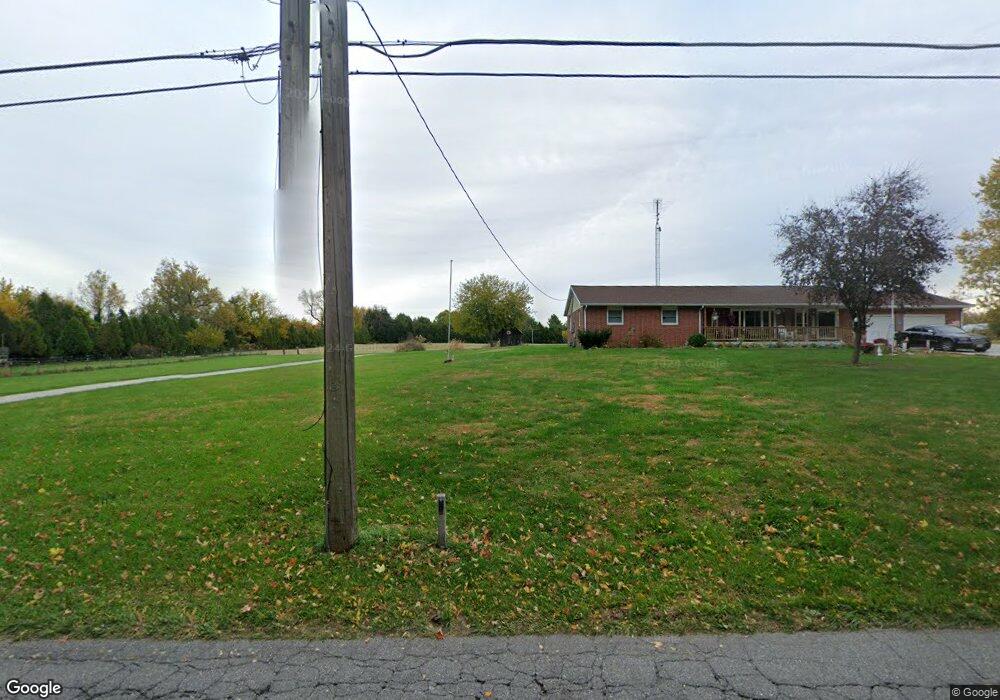
989 N 500 W La Porte, IN 46350
Estimated Value: $446,388 - $484,000
3
Beds
3
Baths
3,294
Sq Ft
$140/Sq Ft
Est. Value
About This Home
This home is located at 989 N 500 W, La Porte, IN 46350 and is currently estimated at $460,463, approximately $139 per square foot. 989 N 500 W is a home located in LaPorte County with nearby schools including F. Willard Crichfield Elementary School and La Porte High School.
Ownership History
Date
Name
Owned For
Owner Type
Purchase Details
Closed on
Mar 14, 2025
Sold by
Conlin Walter E and Conlin Walter E
Bought by
Conlin Walter E and Conlin Patty L
Current Estimated Value
Purchase Details
Closed on
Oct 22, 2021
Sold by
Risner Alisha and Risner Brian S
Bought by
Conlin Walter E and Conlin Patty
Purchase Details
Closed on
Nov 2, 2011
Sold by
Klimek Dawn
Bought by
Risner Brian S and Risner Sheena
Purchase Details
Closed on
Jun 28, 2010
Sold by
Risner Brian K
Bought by
Conlin Walter E and Conlin Patty L
Home Financials for this Owner
Home Financials are based on the most recent Mortgage that was taken out on this home.
Original Mortgage
$85,474
Interest Rate
2.72%
Mortgage Type
Seller Take Back
Purchase Details
Closed on
Dec 8, 2009
Sold by
Risner Brian
Bought by
Risner Brian K
Create a Home Valuation Report for This Property
The Home Valuation Report is an in-depth analysis detailing your home's value as well as a comparison with similar homes in the area
Home Values in the Area
Average Home Value in this Area
Purchase History
| Date | Buyer | Sale Price | Title Company |
|---|---|---|---|
| Conlin Walter E | -- | None Listed On Document | |
| Conlin Walter E | -- | None Available | |
| Risner Brian S | -- | None Available | |
| Conlin Walter E | $90,000 | None Available | |
| Risner Brian K | -- | None Available |
Source: Public Records
Mortgage History
| Date | Status | Borrower | Loan Amount |
|---|---|---|---|
| Previous Owner | Conlin Walter E | $85,474 |
Source: Public Records
Tax History Compared to Growth
Tax History
| Year | Tax Paid | Tax Assessment Tax Assessment Total Assessment is a certain percentage of the fair market value that is determined by local assessors to be the total taxable value of land and additions on the property. | Land | Improvement |
|---|---|---|---|---|
| 2024 | $2,770 | $349,300 | $75,800 | $273,500 |
| 2023 | $2,691 | $325,200 | $51,900 | $273,300 |
| 2022 | $3,254 | $298,800 | $48,000 | $250,800 |
| 2021 | $3,028 | $278,800 | $47,600 | $231,200 |
| 2020 | $2,962 | $278,800 | $47,600 | $231,200 |
| 2019 | $3,063 | $282,300 | $48,100 | $234,200 |
| 2018 | $2,813 | $262,100 | $48,200 | $213,900 |
| 2017 | $2,400 | $243,300 | $48,700 | $194,600 |
| 2016 | $1,876 | $218,200 | $59,700 | $158,500 |
| 2014 | $2,316 | $219,200 | $59,700 | $159,500 |
Source: Public Records
Map
Nearby Homes
- 5424 W 150 N
- 1587 N Rustic Dr
- 0 Circle View Ln Unit NRA825261
- 5709 W 150 N
- 1967 N Rustic Ct
- 3977 W Timber Ridge Rd
- 0 N Goldring Rd Unit NRA828377
- 554 N Orr Lake Rd
- 166 N Woodland Dr
- 3866 W Pawnee Dr
- 3566 W Small Rd
- 2721 N Jongkind Park Dr
- 3855 W Johnson Rd
- 2660 N Rembrandt Ln
- 2688 N Van Gogh Dr
- 683 Waverly Rd
- 54 Dogwood Dr
- 343 W Johnson Rd
- 216 Garden St
- 0 N Forrester Rd