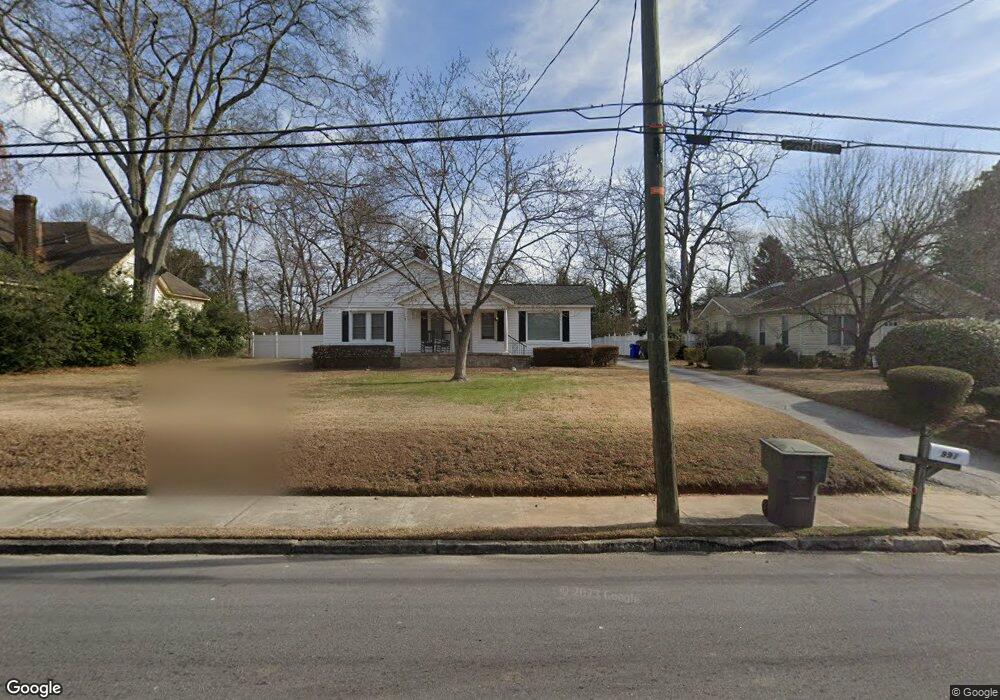
989 N Main St NW Conyers, GA 30012
Estimated Value: $138,738 - $207,000
1
Bed
1
Bath
894
Sq Ft
$190/Sq Ft
Est. Value
About This Home
This home is located at 989 N Main St NW, Conyers, GA 30012 and is currently estimated at $169,935, approximately $190 per square foot. 989 N Main St NW is a home located in Rockdale County with nearby schools including Pine Street Elementary School, Conyers Middle School, and Rockdale County High School.
Ownership History
Date
Name
Owned For
Owner Type
Purchase Details
Closed on
Feb 24, 2025
Sold by
Lindsay Leasing Group Llc
Bought by
Hambrick Corp Llc
Current Estimated Value
Home Financials for this Owner
Home Financials are based on the most recent Mortgage that was taken out on this home.
Original Mortgage
$100,000
Outstanding Balance
$84,745
Interest Rate
6.96%
Mortgage Type
New Conventional
Estimated Equity
$85,190
Purchase Details
Closed on
Oct 13, 2016
Sold by
Garner Susan W
Bought by
Lindsay Leasing Grp Llc
Purchase Details
Closed on
Aug 15, 2008
Sold by
Porter Jeffery
Bought by
Garner Susie
Purchase Details
Closed on
Jul 11, 2008
Sold by
New Century Series 2005-B
Bought by
Porter Jeffery and Garner Susie
Purchase Details
Closed on
Apr 1, 2008
Sold by
Lanier Peggy S
Bought by
New Century Series 2005-B
Purchase Details
Closed on
Aug 5, 2005
Sold by
Cowan Rufus S
Bought by
Lanier Peggy S
Home Financials for this Owner
Home Financials are based on the most recent Mortgage that was taken out on this home.
Original Mortgage
$76,000
Interest Rate
8.58%
Mortgage Type
New Conventional
Create a Home Valuation Report for This Property
The Home Valuation Report is an in-depth analysis detailing your home's value as well as a comparison with similar homes in the area
Home Values in the Area
Average Home Value in this Area
Purchase History
| Date | Buyer | Sale Price | Title Company |
|---|---|---|---|
| Hambrick Corp Llc | $100,000 | -- | |
| Lindsay Leasing Grp Llc | -- | -- | |
| Garner Susie | $50,000 | -- | |
| Porter Jeffery | $55,000 | -- | |
| New Century Series 2005-B | $81,664 | -- | |
| Lanier Peggy S | $80,000 | -- |
Source: Public Records
Mortgage History
| Date | Status | Borrower | Loan Amount |
|---|---|---|---|
| Open | Hambrick Corp Llc | $100,000 | |
| Previous Owner | Lanier Peggy S | $76,000 |
Source: Public Records
Tax History Compared to Growth
Tax History
| Year | Tax Paid | Tax Assessment Tax Assessment Total Assessment is a certain percentage of the fair market value that is determined by local assessors to be the total taxable value of land and additions on the property. | Land | Improvement |
|---|---|---|---|---|
| 2024 | $3,514 | $59,800 | $26,240 | $33,560 |
| 2023 | $3,243 | $53,200 | $24,280 | $28,920 |
| 2022 | $3,152 | $50,880 | $24,280 | $26,600 |
| 2021 | $2,908 | $46,280 | $21,800 | $24,480 |
| 2020 | $2,355 | $33,920 | $12,680 | $21,240 |
| 2019 | $2,018 | $27,120 | $10,280 | $16,840 |
| 2018 | $1,223 | $27,120 | $10,280 | $16,840 |
| 2017 | $1,805 | $24,960 | $10,280 | $14,680 |
| 2016 | $1,815 | $24,960 | $10,280 | $14,680 |
| 2015 | $1,137 | $24,960 | $10,280 | $14,680 |
| 2014 | $1,149 | $24,960 | $10,280 | $14,680 |
| 2013 | -- | $25,400 | $14,200 | $11,200 |
Source: Public Records
Map
Nearby Homes
- 902 Andrews Dr NW
- 893 Andrews Dr NW
- 1068 N Main St NW
- 1070 Barton St NW
- 1204 Lakeview Dr NW
- 1200 Wilson Ct NW
- 1128 Milstead Ave NE
- 1087 N Main St NW
- 1065 Milstead Ave NE
- 1272 Lakeview Dr NW
- 1150 Tinsley Dr NW
- 1064 Eastview Rd NE
- 214 Seward St Unit 94
- 1098 Eastview Cir NE
- 1050 Green Valley Dr NW
- 1349 Springwood Dr NW
- 991 N Main St NW
- 1104 Park Cir NW
- 1116 Park Cir NW
- 985 N Main St NW
- 993 N Main St NW
- 1098 Park Cir NW
- 0 Park Cir NW Unit 8677518
- 0 Park Cir NW Unit 7193110
- 0 Park Cir NW Unit 8904695
- 1734 Middle Brook Dr Unit 203
- 1734 Middle Brook Dr
- 1001 N Main St NW
- 1088 Park Cir NW
- 992 N Main St NW
- 979 N Main St NW
- 1068 Park Cir NW
- 1066 Park Cir NW
- 972 College Ave NW
- 984 N Main St NW
- 1070 Park Cir NW