
Seller's Agent in 2025
Rob Mager
@properties
(317) 703-9990
7 in this area
139 Total Sales


Estimated Value: $298,000 - $325,566
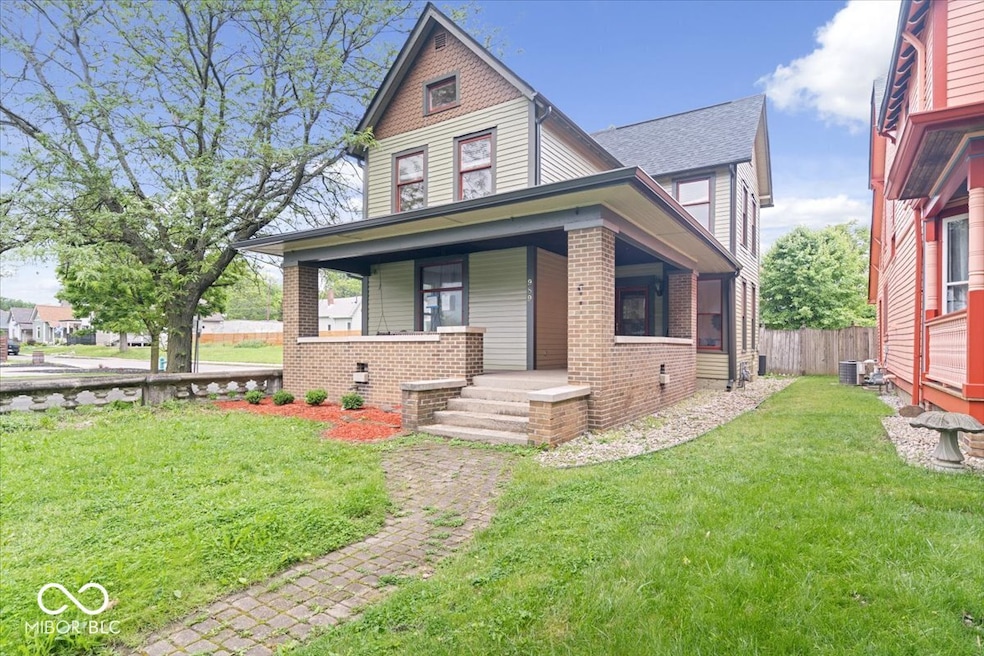
Welcome to 989 Woodruff Place East Drive, a beautifully preserved and thoughtfully updated home nestled in one of Indianapolis' most treasured historic districts. Known for its iconic fountains, globe streetlights, and wide esplanades, Woodruff Place offers timeless beauty and unmatched community charm-just minutes from downtown and the buzzing Bottleworks District. Step inside to find soaring ceilings, rich hardwood floors, and sunlight pouring through oversized windows. The open-concept kitchen is a dream for entertainers and home chefs alike, flowing seamlessly into the dining area. A formal office with a fireplace and a cozy living room round out the main level with warmth and flexibility. Upstairs, the vaulted primary suite is a true retreat, featuring exposed beams and a spa-inspired bathroom. Outside, enjoy morning coffee or evening wine on your private deck-an ideal escape in the city. Whether you're looking for character, comfort, or convenience, this one-of-a-kind home delivers it all in one of Indy's most beloved neighborhoods.
We collect this data history from publicly available records. To have your information removed, we recommend requesting removal directly through your county’s website.
We collect this data history from publicly available records. To have your information removed, we recommend requesting removal directly through your county’s website.
| Date | Buyer | Sale Price | Title Company |
|---|---|---|---|
| -- | First American Title | ||
| -- | None Available |
We collect this data history from publicly available records. To have your information removed, we recommend requesting removal directly through your county’s website.
| Date | Status | Borrower | Loan Amount |
|---|---|---|---|
| Open | $285,000 | ||
| Previous Owner | $170,000 |
We collect this data history from publicly available records. To have your information removed, we recommend requesting removal directly through your county’s website.
| Date | Event | Price | List to Sale | Price per Sq Ft |
|---|---|---|---|---|
| 12/16/2025 12/16/25 | Sold | $300,000 | -7.7% | $155 / Sq Ft |
| 11/25/2025 11/25/25 | For Sale | $325,000 | +8.3% | $168 / Sq Ft |
| 11/23/2025 11/23/25 | Pending | -- | -- | -- |
| 11/21/2025 11/21/25 | Off Market | $300,000 | -- | -- |
| 10/03/2025 10/03/25 | Price Changed | $325,000 | -6.9% | $168 / Sq Ft |
| 09/15/2025 09/15/25 | For Sale | $349,000 | 0.0% | $181 / Sq Ft |
| 09/06/2025 09/06/25 | Pending | -- | -- | -- |
| 08/08/2025 08/08/25 | Price Changed | $349,000 | -3.1% | $181 / Sq Ft |
| 07/09/2025 07/09/25 | Price Changed | $360,000 | -4.0% | $186 / Sq Ft |
| 06/18/2025 06/18/25 | Price Changed | $375,000 | -2.6% | $194 / Sq Ft |
| 05/21/2025 05/21/25 | For Sale | $385,000 | 0.0% | $199 / Sq Ft |
| 11/12/2024 11/12/24 | Off Market | $2,500 | -- | -- |
| 10/08/2024 10/08/24 | Off Market | $2,500 | -- | -- |
| 09/28/2024 09/28/24 | For Rent | $2,500 | 0.0% | -- |
| 07/01/2021 07/01/21 | For Rent | $2,500 | -- | -- |
We collect this data history from publicly available records. To have your information removed, we recommend requesting removal directly through your county’s website.
| Year | Tax Paid | Tax Assessment Tax Assessment Total Assessment is a certain percentage of the fair market value that is determined by local assessors to be the total taxable value of land and additions on the property. | Land | Improvement |
|---|---|---|---|---|
| 2025 | $6,863 | $329,300 | $49,900 | $279,400 |
| 2024 | $7,284 | $289,200 | $49,900 | $239,300 |
| 2023 | $7,284 | $296,000 | $49,900 | $246,100 |
| 2022 | $6,877 | $280,200 | $49,900 | $230,300 |
| 2021 | $6,187 | $257,800 | $49,900 | $207,900 |
| 2020 | $4,835 | $198,500 | $21,700 | $176,800 |
| 2019 | $4,607 | $185,200 | $21,700 | $163,500 |
| 2018 | $4,349 | $172,800 | $21,700 | $151,100 |
| 2017 | $3,691 | $162,600 | $21,700 | $140,900 |
| 2016 | $3,469 | $155,500 | $21,700 | $133,800 |
| 2014 | $3,238 | $150,000 | $21,700 | $128,300 |
| 2013 | $3,201 | $132,900 | $21,700 | $111,200 |
Seller's Agent in 2025
Rob Mager
@properties
(317) 703-9990
7 in this area
139 Total Sales
Seller Co-Listing Agent in 2025
Nicole Busse
@properties
(317) 750-2619
1 in this area
22 Total Sales
Buyer's Agent in 2025
Debbie Pidgeon
United Real Estate Indpls
(317) 627-8982
24 in this area
64 Total Sales
Source: MIBOR Broker Listing Cooperative®
MLS Number: 22038329
APN: 49-10-06-168-225.000-101
Disclaimer: Certain information contained herein is derived from information provided by parties other than Homes.com. All information provided is deemed reliable, but is not guaranteed to be accurate and should be independently verified.
![]() All data is obtained from various sources and may not have been verified by broker or MLS GRID. Supplied Open House Information is subject to change without notice. All information should be independently reviewed and verified for accuracy. Properties may or may not be listed by the office/agent presenting the information. Some IDX listings have been excluded from this website.
All data is obtained from various sources and may not have been verified by broker or MLS GRID. Supplied Open House Information is subject to change without notice. All information should be independently reviewed and verified for accuracy. Properties may or may not be listed by the office/agent presenting the information. Some IDX listings have been excluded from this website.
Listings courtesy of MIBOR Broker Listing Cooperative® as distributed by MLS GRID.
Based on information submitted to the MLS GRID
Ask me questions while you tour the home.