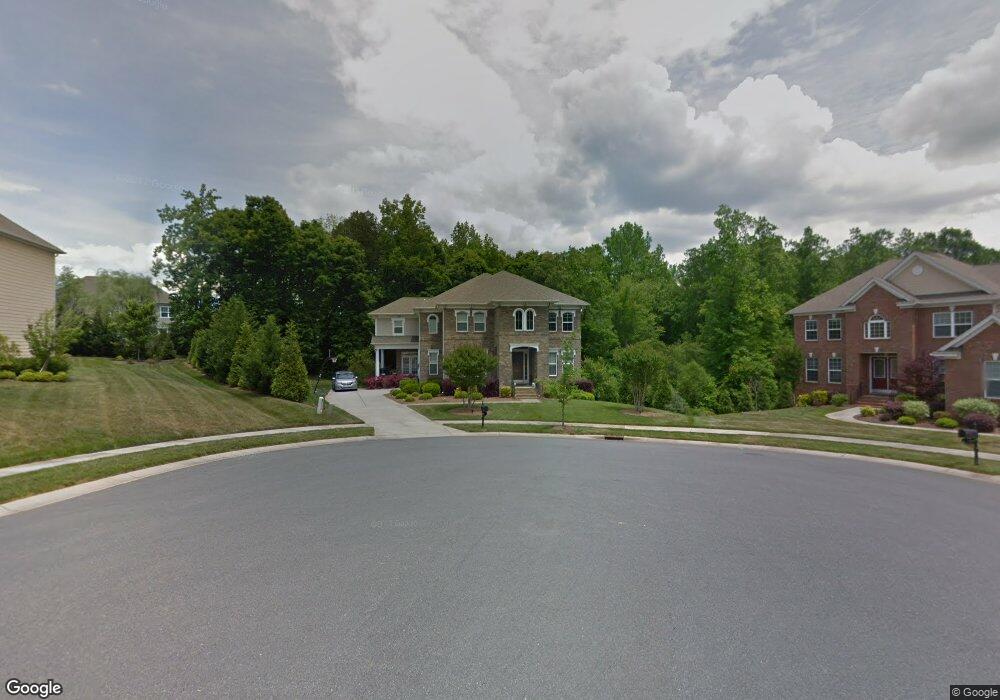
9895 Fern Dancer Ct Concord, NC 28027
Estimated Value: $697,000 - $836,000
5
Beds
4
Baths
5,685
Sq Ft
$135/Sq Ft
Est. Value
About This Home
This home is located at 9895 Fern Dancer Ct, Concord, NC 28027 and is currently estimated at $768,935, approximately $135 per square foot. 9895 Fern Dancer Ct is a home located in Cabarrus County with nearby schools including W.R. Odell Elementary School, Harris Road Middle, and Cox Mill High School.
Ownership History
Date
Name
Owned For
Owner Type
Purchase Details
Closed on
Jan 3, 2013
Sold by
Southside Neighborhood Llc
Bought by
Nvr Inc
Current Estimated Value
Purchase Details
Closed on
Sep 21, 2012
Sold by
Brown Steven L
Bought by
Adams Harold Stanbery and Adams Kimberly Anne
Home Financials for this Owner
Home Financials are based on the most recent Mortgage that was taken out on this home.
Original Mortgage
$370,500
Interest Rate
3.43%
Mortgage Type
New Conventional
Purchase Details
Closed on
May 19, 2008
Sold by
The Ryland Group Inc
Bought by
Brown Steven L
Home Financials for this Owner
Home Financials are based on the most recent Mortgage that was taken out on this home.
Original Mortgage
$371,608
Interest Rate
5.46%
Mortgage Type
Purchase Money Mortgage
Purchase Details
Closed on
Oct 22, 2007
Sold by
Rhein Interests Of Charlotte Llc
Bought by
The Ryland Group Inc
Create a Home Valuation Report for This Property
The Home Valuation Report is an in-depth analysis detailing your home's value as well as a comparison with similar homes in the area
Home Values in the Area
Average Home Value in this Area
Purchase History
| Date | Buyer | Sale Price | Title Company |
|---|---|---|---|
| Nvr Inc | $50,000 | None Available | |
| Adams Harold Stanbery | $390,000 | None Available | |
| Brown Steven L | $465,000 | None Available | |
| The Ryland Group Inc | $70,000 | None Available |
Source: Public Records
Mortgage History
| Date | Status | Borrower | Loan Amount |
|---|---|---|---|
| Previous Owner | Adams Harold Stanbery | $370,500 | |
| Previous Owner | Brown Steven L | $371,608 |
Source: Public Records
Tax History Compared to Growth
Tax History
| Year | Tax Paid | Tax Assessment Tax Assessment Total Assessment is a certain percentage of the fair market value that is determined by local assessors to be the total taxable value of land and additions on the property. | Land | Improvement |
|---|---|---|---|---|
| 2025 | $6,600 | $662,670 | $115,000 | $547,670 |
| 2024 | $6,600 | $662,670 | $115,000 | $547,670 |
| 2023 | $5,376 | $440,670 | $75,000 | $365,670 |
| 2022 | $5,376 | $440,670 | $75,000 | $365,670 |
| 2021 | $5,376 | $440,670 | $75,000 | $365,670 |
| 2020 | $5,376 | $440,670 | $75,000 | $365,670 |
| 2019 | $4,923 | $403,510 | $65,000 | $338,510 |
| 2018 | $4,842 | $403,510 | $65,000 | $338,510 |
| 2017 | $4,761 | $403,510 | $65,000 | $338,510 |
| 2016 | $2,825 | $372,340 | $50,000 | $322,340 |
| 2015 | $4,394 | $372,340 | $50,000 | $322,340 |
| 2014 | $4,394 | $372,340 | $50,000 | $322,340 |
Source: Public Records
Map
Nearby Homes
- 9879 Darby Creek Ave NW
- 1123 Donelea Ln NW
- 9913 Violet Cannon Dr NW
- 10149 Meeting House Dr NW
- 9910 Oaklawn Blvd NW
- The Cambridge Plan at The Villas at Tucker's Walk
- The Syrah Plan at The Villas at Tucker's Walk
- The Moscato Plan at The Villas at Tucker's Walk
- The Bordeaux Plan at The Villas at Tucker's Walk
- The Merlot Plan at The Villas at Tucker's Walk
- 107 Northchase Dr
- 1349 Bridgeford Dr NW
- 8804 Chinaberry Ln
- 1319 Bridgeford Dr NW
- 695 Poplar View Dr
- 9610 Walkers Glen Dr NW
- 1086 MacAllum Dr NW
- 11332 Savannah Grove Dr
- 709 Hope St
- 9586 Kartey Ave NW
- 9891 Fern Dancer Ct
- 9899 Fern Dancer Ct
- 9844 Flower Bonnet Ave NW
- 9847 Flower Bonnet Ave NW
- 9887 Fern Dancer Ct
- 9898 Fern Dancer Ct
- 9894 Fern Dancer Ct
- 9851 Flower Bonnet Ave NW
- 9848 Flower Bonnet Ave NW
- 9890 Fern Dancer Ct
- 9883 Fern Dancer Ct
- 9886 Fern Dancer Ct
- 9886 Fern Dancer Ct Unit 175
- 9852 Flower Bonnet Ave NW
- 9855 Flower Bonnet Ave NW
- 9844 Darby Creek Ave NW
- 9840 Darby Creek Ave NW
- 9848 Darby Creek Ave NW
- 9879 Fern Dancer Ct
- 9882 Fern Dancer Ct