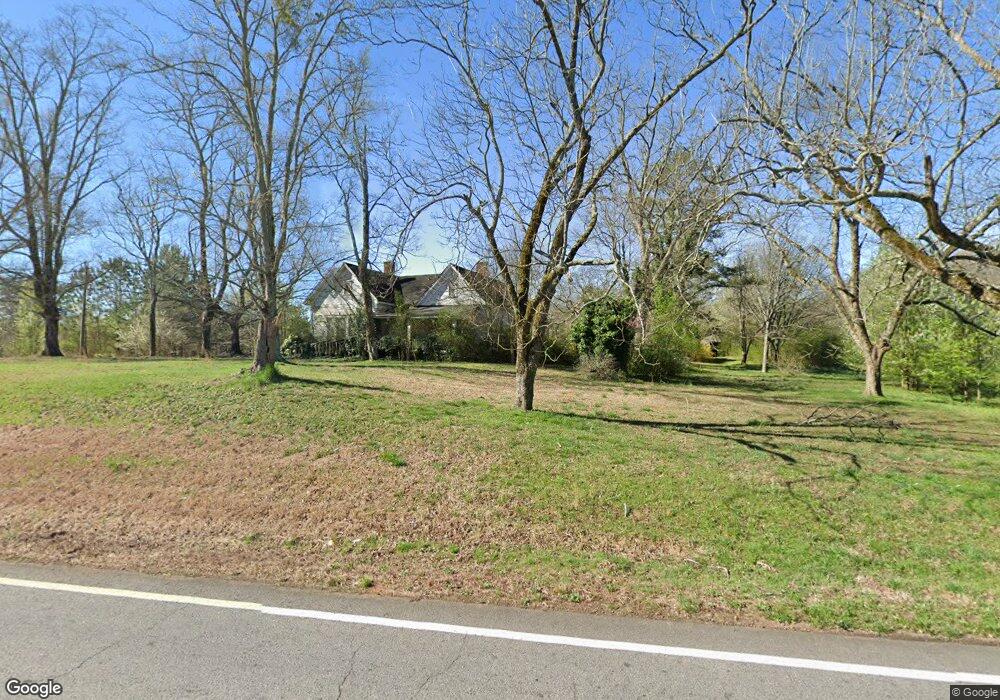
9897 Holly Springs Rd Gillsville, GA 30543
Southeast Gainesville NeighborhoodEstimated Value: $407,000 - $1,568,330
--
Bed
2
Baths
1,476
Sq Ft
$669/Sq Ft
Est. Value
About This Home
This home is located at 9897 Holly Springs Rd, Gillsville, GA 30543 and is currently estimated at $987,665, approximately $669 per square foot. 9897 Holly Springs Rd is a home located in Jackson County with nearby schools including North Jackson Elementary School, West Jackson Middle School, and Jackson County High School.
Ownership History
Date
Name
Owned For
Owner Type
Purchase Details
Closed on
Nov 23, 2020
Sold by
Rebecca Jane Sailors Testamentary Trust
Bought by
Sailors Richard H and Sailors Pamela Rene
Current Estimated Value
Purchase Details
Closed on
Jul 9, 2015
Sold by
Sailors Rebecca Jane
Bought by
Sailors Rebecca Jane Testament and O Richard Sailors C
Purchase Details
Closed on
Jul 30, 2014
Sold by
Pickett Christa Sue L
Bought by
Pickett Mark L and Pastor Paige P
Purchase Details
Closed on
Mar 26, 2009
Sold by
Pickett Christa Sue L
Bought by
Pickett Christa Sue
Purchase Details
Closed on
Mar 22, 2008
Sold by
Not Provided
Bought by
Pickett Christa Sue L and Pickett Rebecca Jane L Sailors
Purchase Details
Closed on
Oct 26, 2005
Sold by
Langford Grady
Bought by
Langford Geraldine
Purchase Details
Closed on
Jul 1, 1999
Sold by
Langford Grady
Bought by
Langford Grady
Create a Home Valuation Report for This Property
The Home Valuation Report is an in-depth analysis detailing your home's value as well as a comparison with similar homes in the area
Home Values in the Area
Average Home Value in this Area
Purchase History
| Date | Buyer | Sale Price | Title Company |
|---|---|---|---|
| Sailors Richard H | -- | -- | |
| Sailors Rebecca Jane Testament | -- | -- | |
| Pickett Mark L | -- | -- | |
| Pickett Christa Sue | -- | -- | |
| Pickett Christa Sue L | -- | -- | |
| Langford Geraldine | -- | -- | |
| Langford Grady | -- | -- |
Source: Public Records
Tax History Compared to Growth
Tax History
| Year | Tax Paid | Tax Assessment Tax Assessment Total Assessment is a certain percentage of the fair market value that is determined by local assessors to be the total taxable value of land and additions on the property. | Land | Improvement |
|---|---|---|---|---|
| 2024 | $2,058 | $421,160 | $407,960 | $13,200 |
| 2023 | $2,037 | $561,320 | $527,400 | $33,920 |
| 2022 | $8,226 | $290,400 | $263,680 | $26,720 |
| 2021 | $8,284 | $290,400 | $263,680 | $26,720 |
| 2020 | $8,939 | $285,680 | $263,680 | $22,000 |
| 2019 | $9,076 | $285,680 | $263,680 | $22,000 |
| 2018 | $2,303 | $228,480 | $207,520 | $20,960 |
| 2017 | $2,272 | $207,135 | $186,801 | $20,334 |
| 2016 | $2,238 | $207,135 | $186,801 | $20,334 |
| 2015 | $2,203 | $207,135 | $186,801 | $20,334 |
| 2014 | $2,181 | $207,317 | $186,801 | $20,516 |
| 2013 | -- | $207,316 | $186,801 | $20,515 |
Source: Public Records
Map
Nearby Homes
- 4201 Holly Springs Rd
- 4149 Meadow Point Dr
- 4359 Saddlewood Ct
- 4274 Pillsbury Rd
- 4661 Turning Leaf Dr
- 4418 Leafview Way
- 3004 Lipscomb Lake Rd
- 4073 Twin Springs Rd
- 4506 Turning Leaf Dr
- 4781 Turning Leaf Dr
- 4239 Mangum Mill Rd
- 4390 Campbell Rd
- 3986 Pinedale Ln
- 11 Owens Rd
- 4446 Gillsville Hwy
- 4638 Cobb Griffin Rd
- 3200 Unity Church Rd
- 0 Unity Church Rd Unit 7657175
- 0 Unity Church Rd Unit CL340705
- 0 Unity Church Rd Unit 10614442
- 9900 Holly Springs Rd
- 9900 Holly Springs Rd
- 9814 Holly Springs Rd
- 0 Holly Springs Rd Unit 10037646
- 4468 Holly Springs Rd
- 4448 Holly Springs Rd
- 0 Buffington Dr Unit 5950812
- 0 Buffington Dr Unit 5940054
- 0 Buffington Dr Unit 8295970
- 0 Buffington Dr Unit 8861509
- 0 Buffington Dr Unit 8500701
- 0 Buffington Dr
- 00 Buffington Dr
- 0 Buffington Dr Unit 7601308
- 0 Buffington Dr Unit 7162668
- 0 Buffington Dr Unit 9019150
- 0 Buffington Dr Unit 6918693
- 0 Buffington Dr Unit 8392436
- 0 Buffington Dr Unit 8489014
- 4428 Holly Springs Rd