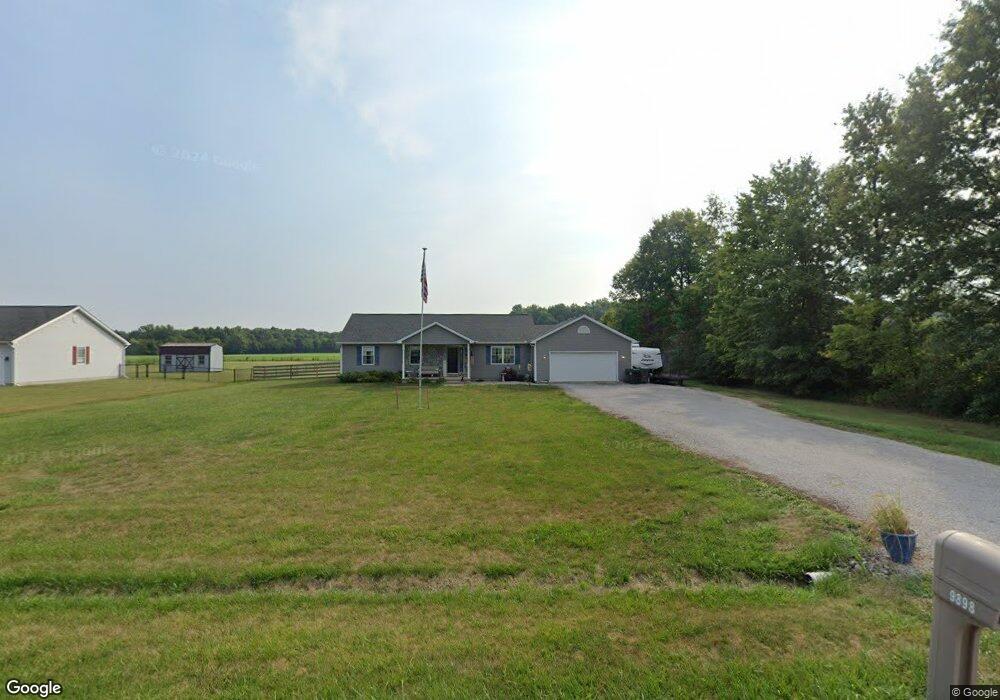
9898 Jackson Runyan Rd Pleasant Plain, OH 45162
Estimated Value: $294,639 - $405,000
3
Beds
2
Baths
1,440
Sq Ft
$235/Sq Ft
Est. Value
About This Home
This home is located at 9898 Jackson Runyan Rd, Pleasant Plain, OH 45162 and is currently estimated at $338,910, approximately $235 per square foot. 9898 Jackson Runyan Rd is a home located in Warren County with nearby schools including Little Miami Early Childhood Center, Little Miami Intermediate Middle School, and Little Miami Middle School.
Ownership History
Date
Name
Owned For
Owner Type
Purchase Details
Closed on
Dec 16, 2005
Sold by
Malicote Donald E and Malicote Frances M
Bought by
Myers Larry C and Myers Lisa M
Current Estimated Value
Home Financials for this Owner
Home Financials are based on the most recent Mortgage that was taken out on this home.
Original Mortgage
$123,040
Outstanding Balance
$79,124
Interest Rate
9.38%
Mortgage Type
Fannie Mae Freddie Mac
Estimated Equity
$259,786
Purchase Details
Closed on
Nov 29, 2005
Sold by
Baker Allan G
Bought by
Malicote Donald E and Malicote Frances M
Home Financials for this Owner
Home Financials are based on the most recent Mortgage that was taken out on this home.
Original Mortgage
$123,040
Outstanding Balance
$79,124
Interest Rate
9.38%
Mortgage Type
Fannie Mae Freddie Mac
Estimated Equity
$259,786
Create a Home Valuation Report for This Property
The Home Valuation Report is an in-depth analysis detailing your home's value as well as a comparison with similar homes in the area
Home Values in the Area
Average Home Value in this Area
Purchase History
| Date | Buyer | Sale Price | Title Company |
|---|---|---|---|
| Myers Larry C | $153,800 | Vantage Land Title | |
| Malicote Donald E | $153,800 | Vantage Land Title |
Source: Public Records
Mortgage History
| Date | Status | Borrower | Loan Amount |
|---|---|---|---|
| Open | Myers Larry C | $123,040 | |
| Previous Owner | Malicote Donald E | $30,760 |
Source: Public Records
Tax History
| Year | Tax Paid | Tax Assessment Tax Assessment Total Assessment is a certain percentage of the fair market value that is determined by local assessors to be the total taxable value of land and additions on the property. | Land | Improvement |
|---|---|---|---|---|
| 2025 | $3,044 | $75,020 | $18,920 | $56,100 |
| 2024 | $3,044 | $75,020 | $18,920 | $56,100 |
| 2023 | $2,699 | $60,130 | $10,300 | $49,829 |
| 2022 | $2,665 | $60,130 | $10,301 | $49,830 |
| 2021 | $2,526 | $60,130 | $10,301 | $49,830 |
| 2020 | $2,401 | $48,888 | $8,376 | $40,513 |
| 2019 | $2,488 | $48,888 | $8,376 | $40,513 |
| 2018 | $2,532 | $48,888 | $8,376 | $40,513 |
| 2017 | $2,264 | $43,572 | $7,641 | $35,931 |
| 2016 | $2,315 | $43,572 | $7,641 | $35,931 |
| 2015 | $2,318 | $43,572 | $7,641 | $35,931 |
| 2014 | $2,427 | $40,760 | $7,190 | $33,580 |
| 2013 | $2,385 | $48,090 | $8,380 | $39,710 |
Source: Public Records
Map
Nearby Homes
- 9589 Jackson Runyan Rd
- 10957 Creekside Dr
- 10173 Walnut St
- 7145 Edenton Pleasant Plain Rd
- 85ac Templin Rd
- 8469 McCulley Ln
- 8347 McCulley Ln
- 7334 Templin Rd
- 0 Morrow Woodville Rd Unit 1863872
- 0 Roachester Cozaddale Rd Unit 1868050
- 0 Roachester-Cozaddale Rd
- 7771 Misty Meadows Ct
- 6672 Garrison Spurling Rd
- 7231 Watkins-Starkey Rd
- 2271 State Route 28
- 194 Old St Rt 133
- 6779 Crestbrook Dr
- 6780 Crestbrook Dr
- 15ac Landing Ln
- 6600 Ripple Bend Dr
- 9882 Jackson Runyan Rd
- 9860 Jackson Runyan Rd
- 9830 Jackson Runyan Rd
- 9804 Jackson Runyan Rd
- 9782 Jackson Runyan Rd
- 9782 Jackson Harlan Rd
- 9764 Jackson Runyan Rd
- 9746 Jackson Runyan Rd
- 10055 Jackson Runyan Rd
- 9728 Jackson Runyan Rd
- 9616 Jackson Runyan Rd
- 9635 Jackson Runyan Rd
- 9577 Jackson Runyan Rd
- 9651 Jackson Runyan Rd
- 9520 Jackson Runyan Rd
- 9529 Jackson Runyan Rd
- 9317 Morrow Woodville Rd
- 9480 Jackson Runyan Rd
- 7500 Starkey Rd
- 9373 Morrow Woodville Rd
Your Personal Tour Guide
Ask me questions while you tour the home.