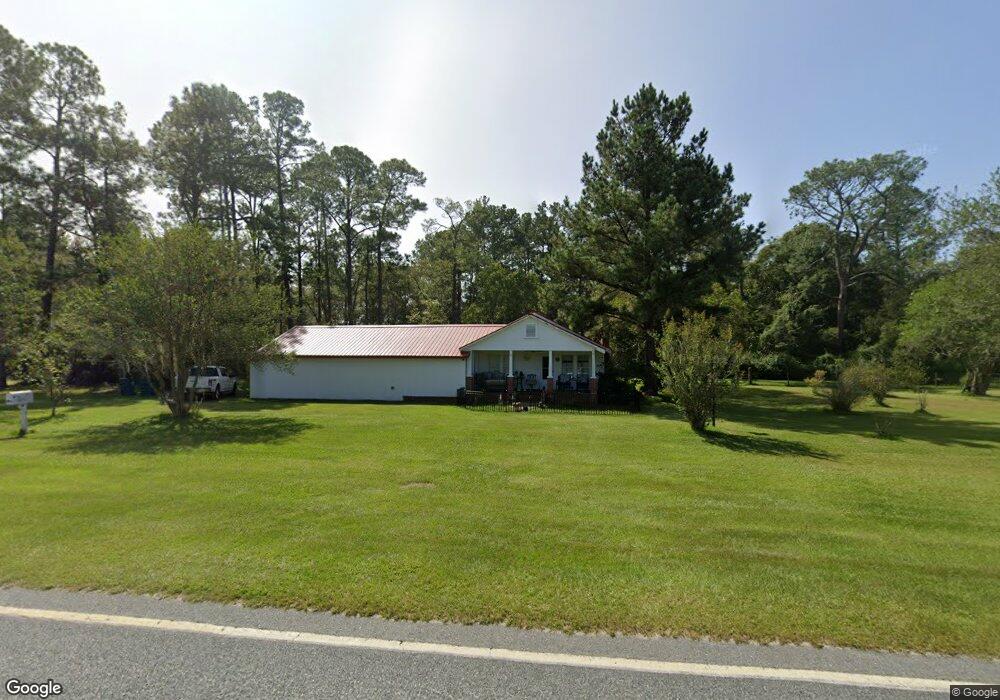
9898 Trudie Rd Patterson, GA 31557
Estimated Value: $230,000 - $345,840
--
Bed
1
Bath
1,235
Sq Ft
$233/Sq Ft
Est. Value
About This Home
This home is located at 9898 Trudie Rd, Patterson, GA 31557 and is currently estimated at $287,920, approximately $233 per square foot. 9898 Trudie Rd is a home located in Brantley County with nearby schools including Nahunta Primary School, Nahunta Elementary School, and Brantley County Middle School.
Ownership History
Date
Name
Owned For
Owner Type
Purchase Details
Closed on
Jul 8, 2022
Sold by
Manning Tyrus J
Bought by
Manning Family Liv Trust
Current Estimated Value
Purchase Details
Closed on
Dec 24, 2019
Sold by
Manning Tyrus J
Bought by
Manning Marian M
Purchase Details
Closed on
May 18, 2005
Sold by
Payne Norma M
Bought by
Crabb Larry W and Crabb Morgan M
Home Financials for this Owner
Home Financials are based on the most recent Mortgage that was taken out on this home.
Original Mortgage
$110,000
Interest Rate
5.74%
Mortgage Type
New Conventional
Purchase Details
Closed on
Apr 19, 2005
Sold by
Strickland Robin T
Bought by
Strickland D Wain
Home Financials for this Owner
Home Financials are based on the most recent Mortgage that was taken out on this home.
Original Mortgage
$110,000
Interest Rate
5.74%
Mortgage Type
New Conventional
Create a Home Valuation Report for This Property
The Home Valuation Report is an in-depth analysis detailing your home's value as well as a comparison with similar homes in the area
Home Values in the Area
Average Home Value in this Area
Purchase History
| Date | Buyer | Sale Price | Title Company |
|---|---|---|---|
| Manning Family Liv Trust | -- | -- | |
| Manning Marian M | -- | -- | |
| Crabb Larry W | $3,200 | -- | |
| Strickland D Wain | -- | -- |
Source: Public Records
Mortgage History
| Date | Status | Borrower | Loan Amount |
|---|---|---|---|
| Previous Owner | Crabb Larry W | $110,000 |
Source: Public Records
Tax History Compared to Growth
Tax History
| Year | Tax Paid | Tax Assessment Tax Assessment Total Assessment is a certain percentage of the fair market value that is determined by local assessors to be the total taxable value of land and additions on the property. | Land | Improvement |
|---|---|---|---|---|
| 2024 | $322 | $108,803 | $84,319 | $24,484 |
| 2023 | $322 | $86,880 | $63,756 | $23,124 |
| 2022 | $322 | $84,880 | $63,756 | $21,124 |
| 2021 | $302 | $75,136 | $63,756 | $11,380 |
| 2020 | $302 | $75,136 | $63,756 | $11,380 |
| 2019 | $302 | $75,136 | $63,756 | $11,380 |
| 2018 | $0 | $52,139 | $40,759 | $11,380 |
| 2017 | $0 | $52,139 | $40,759 | $11,380 |
| 2016 | $1,681 | $52,139 | $40,759 | $11,380 |
| 2015 | -- | $52,139 | $40,759 | $11,380 |
Source: Public Records
Map
Nearby Homes
- 0 Humpback Rd
- 0 Woodrow Ln
- 0 Roberson Rd
- 0 Roberson Rd Unit 21711381
- 14375 Hwy 301 N
- 17082 Hwy 341
- 13929 Raybon Rd E
- 00 Lewis Landing
- 3362 Seed Orchard Rd
- 559 Cumberland Rd
- 603 Cumberland Rd
- 255 Spell Landing Rd
- 6911 Old Hortense Rd
- 4452 Pembers Rd
- 18583 Raybon Rd E
- 584 Knox St
- 4432 Pembers Rd
- 0 Johns Rd
- 20.55 ACRES U S Highway 82
- 92 Ervin St
- 9898 Trudie Rd
- 9802 Trudie Rd
- 9690 Trudie Rd
- 5110 Taylor Rd
- 75 Eldridge Rd
- 121 Eldridge Rd
- 135 Eldridge Rd
- 253 Eldridge Rd
- 10859 Trudie Rd
- 0 Cross Swamp Rd
- 0 Cross Swamp Rd Unit 23264
- 0 Cross Swamp Rd Unit 7382063
- 0 Cross Swamp Rd Unit 7483116
- 10936 Trudie Rd
- 187 Eldridge Rd
- 289 Eldridge Rd
- 11056 Trudie Rd