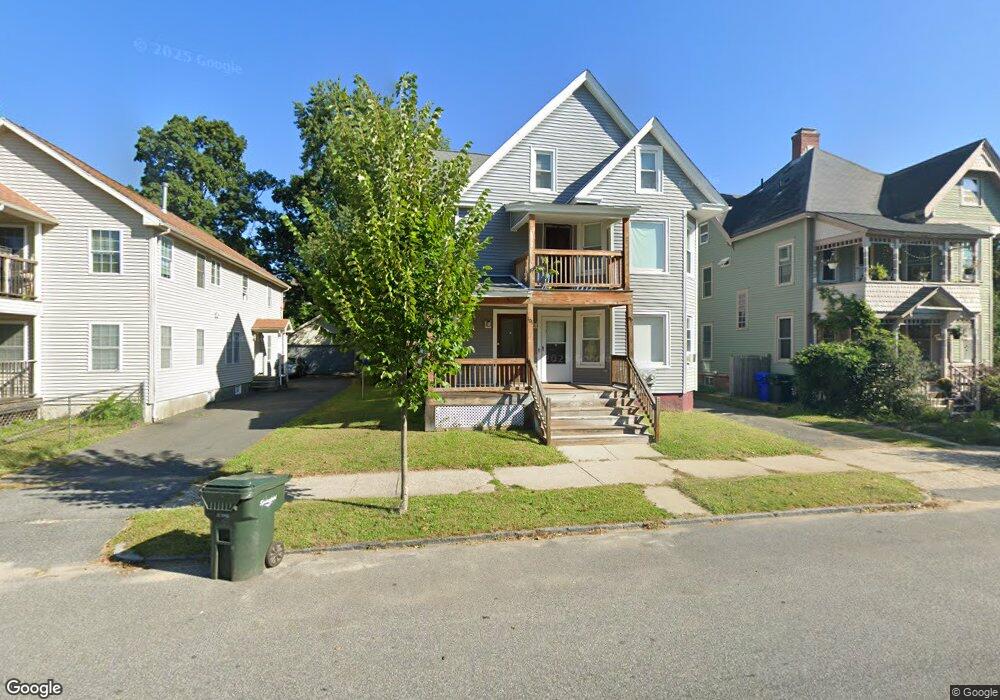
99-101 Princeton St Springfield, MA 01109
McKnight NeighborhoodEstimated Value: $371,004 - $413,000
7
Beds
2
Baths
3,070
Sq Ft
$128/Sq Ft
Est. Value
About This Home
This home is located at 99-101 Princeton St, Springfield, MA 01109 and is currently estimated at $391,501, approximately $127 per square foot. 99-101 Princeton St is a home located in Hampden County with nearby schools including Van Sickle Academy, High School Of Commerce, and Springfield Central High School.
Ownership History
Date
Name
Owned For
Owner Type
Purchase Details
Closed on
Jul 28, 2020
Sold by
Wachezaji Inv Grp Llc
Bought by
Smith Elvis
Current Estimated Value
Home Financials for this Owner
Home Financials are based on the most recent Mortgage that was taken out on this home.
Original Mortgage
$260,690
Outstanding Balance
$231,677
Interest Rate
3.1%
Mortgage Type
FHA
Estimated Equity
$159,824
Purchase Details
Closed on
Oct 22, 2019
Sold by
Reavis Darryl F
Bought by
Wachezaji Investment Grp
Purchase Details
Closed on
Dec 11, 2000
Sold by
Ge Capital Mtg Svcs
Bought by
Reavis Darryl F
Home Financials for this Owner
Home Financials are based on the most recent Mortgage that was taken out on this home.
Original Mortgage
$50,000
Interest Rate
7.64%
Mortgage Type
Purchase Money Mortgage
Purchase Details
Closed on
Aug 16, 2000
Sold by
Johnson Melvin G and Johnson Shirley L
Bought by
Ge Capital Mtg Svcs
Purchase Details
Closed on
Mar 2, 1987
Sold by
Est Anthony Bartos
Bought by
Johnson Shirley L
Home Financials for this Owner
Home Financials are based on the most recent Mortgage that was taken out on this home.
Original Mortgage
$35,000
Interest Rate
9.19%
Mortgage Type
Purchase Money Mortgage
Create a Home Valuation Report for This Property
The Home Valuation Report is an in-depth analysis detailing your home's value as well as a comparison with similar homes in the area
Home Values in the Area
Average Home Value in this Area
Purchase History
| Date | Buyer | Sale Price | Title Company |
|---|---|---|---|
| Smith Elvis | $265,500 | None Available | |
| Wachezaji Investment Grp | $60,000 | -- | |
| Reavis Darryl F | $49,900 | -- | |
| Ge Capital Mtg Svcs | $35,000 | -- | |
| Johnson Shirley L | $10,000 | -- |
Source: Public Records
Mortgage History
| Date | Status | Borrower | Loan Amount |
|---|---|---|---|
| Open | Smith Elvis | $260,690 | |
| Previous Owner | Johnson Shirley L | $50,000 | |
| Previous Owner | Johnson Shirley L | $40,000 | |
| Previous Owner | Johnson Shirley L | $19,694 | |
| Previous Owner | Johnson Shirley L | $35,000 |
Source: Public Records
Tax History
| Year | Tax Paid | Tax Assessment Tax Assessment Total Assessment is a certain percentage of the fair market value that is determined by local assessors to be the total taxable value of land and additions on the property. | Land | Improvement |
|---|---|---|---|---|
| 2025 | $4,866 | $310,300 | $25,500 | $284,800 |
| 2024 | $4,640 | $288,900 | $23,800 | $265,100 |
| 2023 | $4,305 | $252,500 | $22,700 | $229,800 |
| 2022 | $4,528 | $240,600 | $20,600 | $220,000 |
| 2021 | $4,143 | $219,200 | $18,800 | $200,400 |
| 2020 | $2,107 | $107,900 | $18,800 | $89,100 |
| 2019 | $1,740 | $88,400 | $16,000 | $72,400 |
| 2018 | $2,328 | $89,700 | $16,000 | $73,700 |
| 2017 | $2,328 | $118,400 | $15,000 | $103,400 |
| 2016 | $1,978 | $100,600 | $15,000 | $85,600 |
| 2015 | $1,501 | $76,300 | $15,000 | $61,300 |
Source: Public Records
Map
Nearby Homes
- 106 Amherst St
- 393 Saint James Ave
- 16 Amherst St
- 21 Clifford St
- 107 Dartmouth St
- 16 Cambridge St
- 158 Bowles St
- 163 Marion St
- 90 Cambridge St
- 15-17 Sycamore St
- 52 Vadnais St
- 145 Cambridge St
- 33 Drexel St
- 41 Florida St
- 52-56 Andrew St
- 123 Bay St
- LOT 3 N S Worthington St
- 65 Montrose St
- 15 Kenyon St
- 9 Utica St
- 99 Princeton St Unit 101
- 105 Princeton St
- 95 Princeton St
- 111 Princeton St
- 10 Lafayette St
- 14 Lafayette St Unit 1
- 4 Lafayette St
- 115 Princeton St
- 20 Lafayette St
- 85 Princeton St
- 98 Princeton St
- 102 Princeton St
- 70 Amherst St
- 108 Princeton St
- 26 Lafayette St
- 121 Princeton St
- 112 Princeton St
- 76 Amherst St
- 41 Amherst St
- 116 Princeton St
Your Personal Tour Guide
Ask me questions while you tour the home.