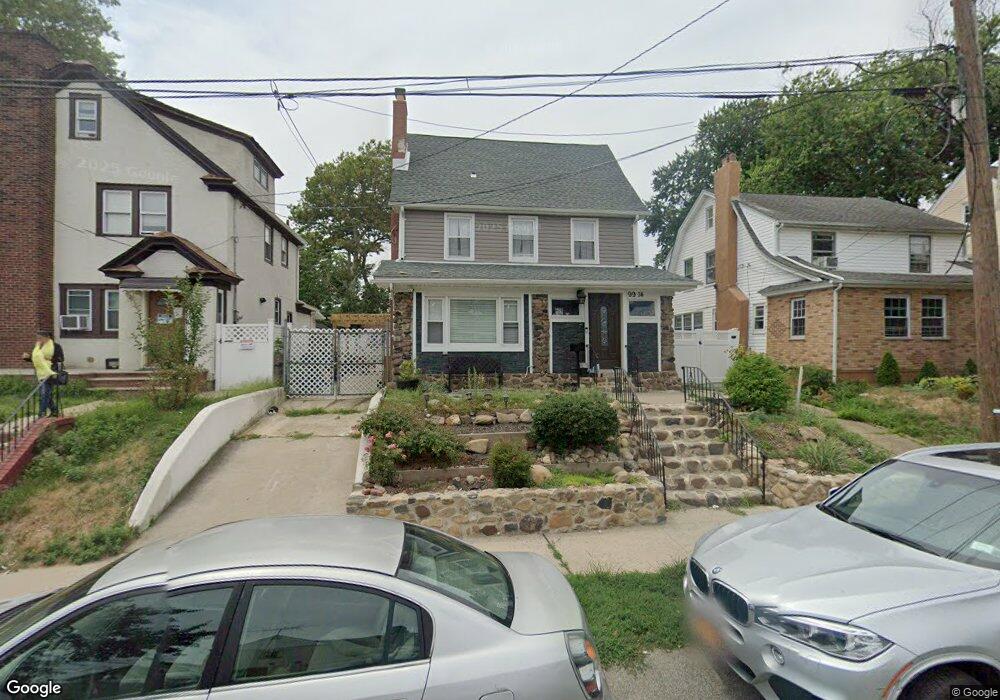
99-14 191st St Hollis, NY 11423
Hollis NeighborhoodEstimated Value: $821,716 - $1,082,000
3
Beds
2
Baths
1,000
Sq Ft
$951/Sq Ft
Est. Value
About This Home
This home is located at 99-14 191st St, Hollis, NY 11423 and is currently estimated at $951,179, approximately $951 per square foot. 99-14 191st St is a home located in Queens County with nearby schools including P.S. 118 Lorraine Hansberry, I.S. 192 The Linden, and Wellspring Elementary & Middle.
Ownership History
Date
Name
Owned For
Owner Type
Purchase Details
Closed on
Feb 15, 2018
Sold by
Metro Tec Homes Llc
Bought by
Barreiro Cesar and Barreiro Elisa
Current Estimated Value
Home Financials for this Owner
Home Financials are based on the most recent Mortgage that was taken out on this home.
Original Mortgage
$770,247
Outstanding Balance
$652,330
Interest Rate
3.99%
Mortgage Type
Purchase Money Mortgage
Estimated Equity
$298,849
Purchase Details
Closed on
Jul 5, 2017
Sold by
James Dimichele Referee
Bought by
Metro Tec Homes Llc
Purchase Details
Closed on
Oct 3, 2008
Sold by
Garcia Hector
Bought by
Almanzar Jose
Home Financials for this Owner
Home Financials are based on the most recent Mortgage that was taken out on this home.
Original Mortgage
$582,315
Interest Rate
6.41%
Purchase Details
Closed on
Mar 20, 2008
Sold by
Estate Of Jennie L Spivey and James Reid As Executor
Bought by
Garcia Hector
Create a Home Valuation Report for This Property
The Home Valuation Report is an in-depth analysis detailing your home's value as well as a comparison with similar homes in the area
Home Values in the Area
Average Home Value in this Area
Purchase History
| Date | Buyer | Sale Price | Title Company |
|---|---|---|---|
| Barreiro Cesar | $797,000 | -- | |
| Metro Tec Homes Llc | $395,460 | -- | |
| Almanzar Jose | $590,000 | -- | |
| Almanzar Jose | $590,000 | -- | |
| Garcia Hector | $280,000 | -- | |
| Garcia Hector | $280,000 | -- |
Source: Public Records
Mortgage History
| Date | Status | Borrower | Loan Amount |
|---|---|---|---|
| Open | Barreiro Cesar | $770,247 | |
| Previous Owner | Almanzar Jose | $582,315 |
Source: Public Records
Tax History Compared to Growth
Tax History
| Year | Tax Paid | Tax Assessment Tax Assessment Total Assessment is a certain percentage of the fair market value that is determined by local assessors to be the total taxable value of land and additions on the property. | Land | Improvement |
|---|---|---|---|---|
| 2025 | $6,242 | $32,941 | $8,635 | $24,306 |
| 2024 | $6,242 | $31,078 | $8,614 | $22,464 |
| 2023 | $5,889 | $29,320 | $8,939 | $20,381 |
| 2022 | $5,853 | $44,520 | $13,920 | $30,600 |
| 2021 | $6,004 | $40,860 | $13,920 | $26,940 |
| 2020 | $5,811 | $38,940 | $13,920 | $25,020 |
| 2019 | $5,418 | $39,660 | $13,920 | $25,740 |
| 2018 | $4,981 | $24,433 | $10,140 | $14,293 |
| 2017 | $4,981 | $24,433 | $12,569 | $11,864 |
| 2016 | $4,753 | $24,433 | $12,569 | $11,864 |
| 2015 | $2,780 | $22,876 | $11,394 | $11,482 |
| 2014 | $2,780 | $21,582 | $10,466 | $11,116 |
Source: Public Records
Map
Nearby Homes
- 189-07 Henderson Ave
- 191-06 102nd Ave
- 190-30 103rd Ave
- 97-08 190th St
- 10211 187th St
- 188-14 Woodhull Ave
- 102-35 187th St
- 188-09 Jamaica Ave
- 19511 Woodhull Ave
- 19515 Woodhull Ave
- 19611 100th Ave
- 194-10 Hollis Ave
- 185-05 Henderson Ave
- 191-13 Jamaica Ave
- 92-22 195th Place
- 10532 192nd St
- 184-15 Henderson Ave
- 19027 109th Rd
- 10533 Farmers Blvd
- 90-44 187th St
- 9914 191st St
- 9910 191st St
- 99-16 191st St
- 9916 191st St
- 9904 191st St
- 9920 191st St
- 9919 Farmers Blvd Unit 99-21
- 9915 Farmers Blvd
- 19112 Hollis Ave
- 9925 Farmers Blvd
- 9925 Farmers Blvd
- 9911 Farmers Blvd
- 19006 Hollis Ave
- 190-06 Hollis Ave Unit 1
- 190-06 Hollis Ave Unit 1R
- 9930 191st St
- 9929 Farmers Blvd
- 9929 Farmers Blvd Unit 2 Fl
- 19124 Hollis Ave
- 9907 Farmers Blvd