Estimated Value: $875,000 - $947,000
3
Beds
2
Baths
1,060
Sq Ft
$855/Sq Ft
Est. Value
About This Home
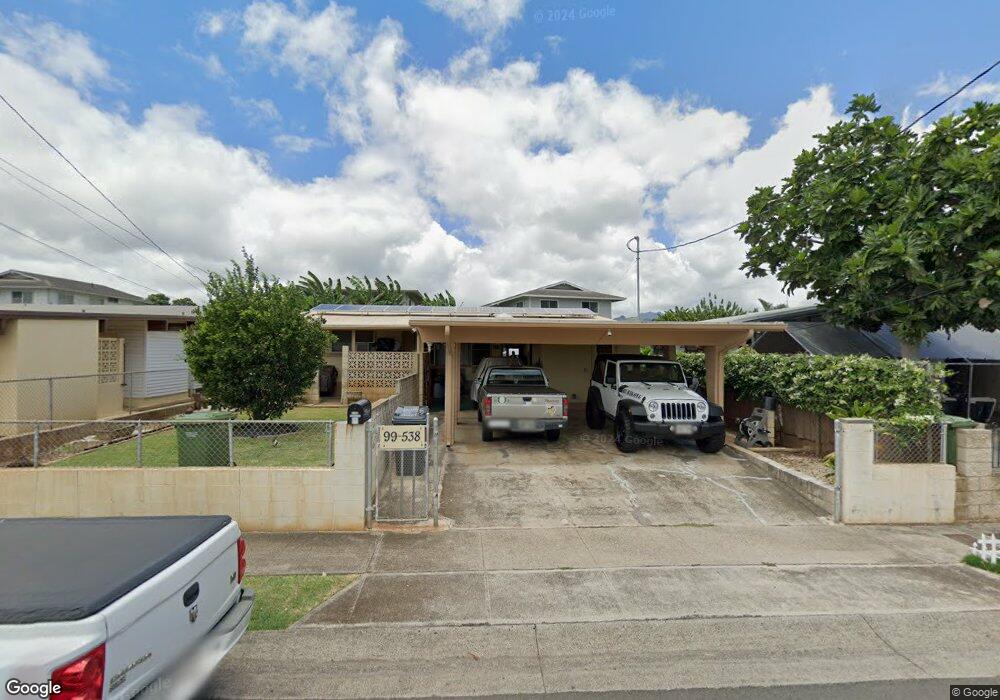
This home is located at 99-538 Opukea St, Aiea, HI 96701 and is currently estimated at $906,287, approximately $854 per square foot. 99-538 Opukea St is a home located in Honolulu County with nearby schools including Aiea Elementary School, Aiea Intermediate School, and Aiea High School.
Ownership History
Date
Name
Owned For
Owner Type
Purchase Details
Closed on
Mar 6, 2020
Sold by
Kiyan Robert Isamu
Bought by
Kiyan Robert I and Kiyan Robert Isamu
Current Estimated Value
Purchase Details
Closed on
Jul 1, 2011
Sold by
Kiyan Robert I and Kiyan Robert Isamu
Bought by
Kiyan Robert Isamu
Purchase Details
Closed on
Dec 22, 2008
Sold by
Kiyan Isamu
Bought by
Kiyan Isamu and Isamu Kiyan Trust
Purchase Details
Closed on
Oct 25, 2006
Sold by
Kihune Robert Kalani Uichi and Ing James Douglas Keauhou
Bought by
Kiyan Robert I and Kiyan Isamu
Home Financials for this Owner
Home Financials are based on the most recent Mortgage that was taken out on this home.
Original Mortgage
$290,000
Outstanding Balance
$172,211
Interest Rate
6.28%
Mortgage Type
Unknown
Estimated Equity
$734,076
Create a Home Valuation Report for This Property
The Home Valuation Report is an in-depth analysis detailing your home's value as well as a comparison with similar homes in the area
Home Values in the Area
Average Home Value in this Area
Purchase History
| Date | Buyer | Sale Price | Title Company |
|---|---|---|---|
| Kiyan Robert I | -- | None Available | |
| Kiyan Robert I | -- | None Available | |
| Kiyan Robert I | -- | None Available | |
| Kiyan Robert Isamu | -- | Accommodation | |
| Kiyan Isamu | -- | None Available | |
| Kiyan Robert I | $267,000 | Tg |
Source: Public Records
Mortgage History
| Date | Status | Borrower | Loan Amount |
|---|---|---|---|
| Open | Kiyan Robert I | $290,000 |
Source: Public Records
Tax History Compared to Growth
Tax History
| Year | Tax Paid | Tax Assessment Tax Assessment Total Assessment is a certain percentage of the fair market value that is determined by local assessors to be the total taxable value of land and additions on the property. | Land | Improvement |
|---|---|---|---|---|
| 2025 | $2,833 | $943,900 | $850,000 | $93,900 |
| 2024 | $2,833 | $969,500 | $890,000 | $79,500 |
| 2023 | $2,644 | $995,400 | $890,000 | $105,400 |
| 2022 | $2,470 | $845,600 | $735,000 | $110,600 |
| 2021 | $1,832 | $663,400 | $585,000 | $78,400 |
| 2020 | $2,149 | $754,000 | $630,000 | $124,000 |
| 2019 | $2,123 | $726,700 | $600,000 | $126,700 |
| 2018 | $1,869 | $654,100 | $550,000 | $104,100 |
| 2017 | $1,906 | $664,700 | $550,000 | $114,700 |
| 2016 | $1,783 | $629,400 | $480,000 | $149,400 |
| 2015 | $1,757 | $622,100 | $450,000 | $172,100 |
| 2014 | -- | $537,800 | $400,000 | $137,800 |
Source: Public Records
Map
Nearby Homes
- 99-535 Opukea St
- 99-015 Kalaloa St Unit 702
- 99-15 Kalaloa St Unit 705
- 99-049 Ohiaku St
- 239 Mananai Place Unit 54
- 1238 Molehu Dr
- 1233 Ala Alii St Unit 5
- 429 Mananai Place Unit 39U
- 1224 Haloa Dr
- 432 Mananai Place Unit 18C
- 504 Mananai Place Unit 14
- 509 Mananai Place Unit 33
- 1447 Uila St
- 585 Mananai Place Unit 26
- 594 Mananai Place Unit 21T
- 4280 Salt Lake Blvd Unit J29
- 4280 Salt Lake Blvd Unit C13
- 4280 Salt Lake Blvd Unit D23
- 626 Mananai Place Unit 626C
- 625 Mananai Place Unit 24A
- 99-542 Opukea St
- 99-536 Opukea St
- 99-539 Kapahulani Place
- 99-532 Opukea St
- 99-533 Kapahulani Place
- 99-546 Opukea St
- 99-537 Kapahulani Place
- 99-192 Ohekani Loop
- 99-541 Opukea St
- 99-537 Opukea St
- 99-548 Opukea St
- 99-530 Opukea St
- 99-543 Kapahulani Place
- 99-196 Ohekani Loop
- 99-545 Opukea St
- 99-531 Opukea St
- 99-541 Kapahulani Place
- 99-549 Opukea St
- 99-202 Ohekani Loop
- 99-127 Kalaloa St