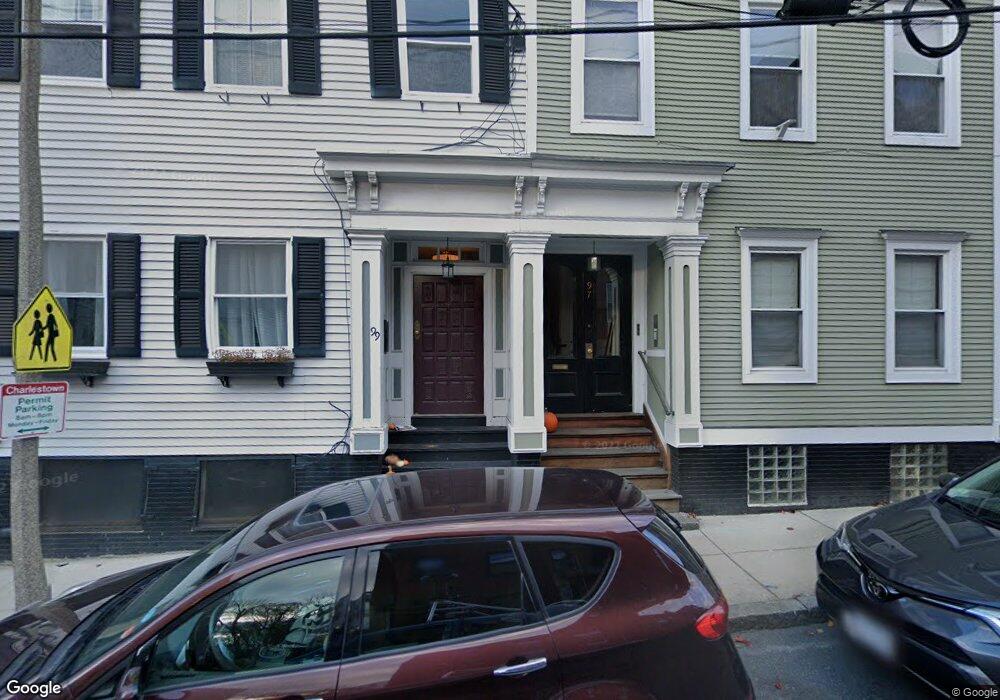
99 Bartlett St Unit 3 Charlestown, MA 02129
Medford Street-The Neck NeighborhoodEstimated Value: $958,000 - $1,393,000
3
Beds
2
Baths
1,500
Sq Ft
$763/Sq Ft
Est. Value
About This Home
This home is located at 99 Bartlett St Unit 3, Charlestown, MA 02129 and is currently estimated at $1,144,689, approximately $763 per square foot. 99 Bartlett St Unit 3 is a home located in Suffolk County with nearby schools including Prospect Hill Academy Upper Elementary Campus.
Ownership History
Date
Name
Owned For
Owner Type
Purchase Details
Closed on
Jun 19, 2012
Sold by
Carr Joan E and Carr Robert E
Bought by
99 Bartlett Street Rt
Current Estimated Value
Purchase Details
Closed on
Jan 31, 2001
Sold by
Lanoue Mark J and Lanoue Susan J
Bought by
Carr Robert E and Carr Joan E
Purchase Details
Closed on
Dec 17, 1997
Sold by
Landro James A and Dickert Laura A
Bought by
Lanoue Mark J and Lanoue Susan J
Home Financials for this Owner
Home Financials are based on the most recent Mortgage that was taken out on this home.
Original Mortgage
$160,000
Interest Rate
7.14%
Mortgage Type
Purchase Money Mortgage
Purchase Details
Closed on
Apr 15, 1992
Sold by
Alin Rt
Bought by
Landro James A
Home Financials for this Owner
Home Financials are based on the most recent Mortgage that was taken out on this home.
Original Mortgage
$92,000
Interest Rate
8.75%
Mortgage Type
Purchase Money Mortgage
Create a Home Valuation Report for This Property
The Home Valuation Report is an in-depth analysis detailing your home's value as well as a comparison with similar homes in the area
Home Values in the Area
Average Home Value in this Area
Purchase History
| Date | Buyer | Sale Price | Title Company |
|---|---|---|---|
| 99 Bartlett Street Rt | -- | -- | |
| Carr Robert E | $385,000 | -- | |
| Lanoue Mark J | $200,000 | -- | |
| Landro James A | $115,000 | -- |
Source: Public Records
Mortgage History
| Date | Status | Borrower | Loan Amount |
|---|---|---|---|
| Previous Owner | Landro James A | $160,000 | |
| Previous Owner | Landro James A | $92,000 |
Source: Public Records
Tax History Compared to Growth
Tax History
| Year | Tax Paid | Tax Assessment Tax Assessment Total Assessment is a certain percentage of the fair market value that is determined by local assessors to be the total taxable value of land and additions on the property. | Land | Improvement |
|---|---|---|---|---|
| 2025 | $10,288 | $888,400 | $0 | $888,400 |
| 2024 | $8,949 | $821,000 | $0 | $821,000 |
| 2023 | $8,554 | $796,500 | $0 | $796,500 |
| 2022 | $8,333 | $765,900 | $0 | $765,900 |
| 2021 | $8,172 | $765,900 | $0 | $765,900 |
| 2020 | $7,847 | $743,100 | $0 | $743,100 |
| 2019 | $6,993 | $663,500 | $0 | $663,500 |
| 2018 | $6,619 | $631,600 | $0 | $631,600 |
| 2017 | $6,433 | $607,500 | $0 | $607,500 |
| 2016 | $6,488 | $589,800 | $0 | $589,800 |
| 2015 | $5,661 | $467,500 | $0 | $467,500 |
| 2014 | $5,393 | $428,700 | $0 | $428,700 |
Source: Public Records
Map
Nearby Homes
- 52 Sullivan St Unit 1
- 94A Bartlett St Unit 3
- 94A Bartlett St Unit 2
- 15 Russell St
- 33 Russell St
- 9 Russell St Unit 1
- 9 Russell St Unit 2
- 14 Wall St
- 246 Bunker Hill St Unit 3
- 236 Bunker Hill St Unit 3
- 255 Bunker Hill St Unit 2
- 64 Walker St Unit 66
- 247 Bunker Hill St Unit A
- 29 Eden St Unit 3
- 16 Eden St Unit 1
- 14 Mystic St Unit 2
- 207 Bunker Hill St Unit 2
- 56 High St Unit 3
- 17 Trenton St
- 339 Bunker Hill St
- 99 Bartlett St Unit 2
- 99 Bartlett St Unit 1
- 97 Bartlett St Unit 3
- 97 Bartlett St Unit 2
- 97 Bartlett St Unit 1
- 101 Bartlett St
- 103 Bartlett St Unit 2
- 103 Bartlett St Unit 1
- 103 Bartlett St Unit 2B
- 103 Bartlett St Unit B
- 103 Bartlett St Unit PH
- 105 Bartlett St Unit 3
- 105 Bartlett St Unit 2
- 105 Bartlett St Unit 1
- 105 Bartlett St
- 60 Sullivan St Unit 2
- 60 Sullivan St Unit 1
- 58 Sullivan St Unit 3
- 58 Sullivan St Unit 2
- 58 Sullivan St Unit 1