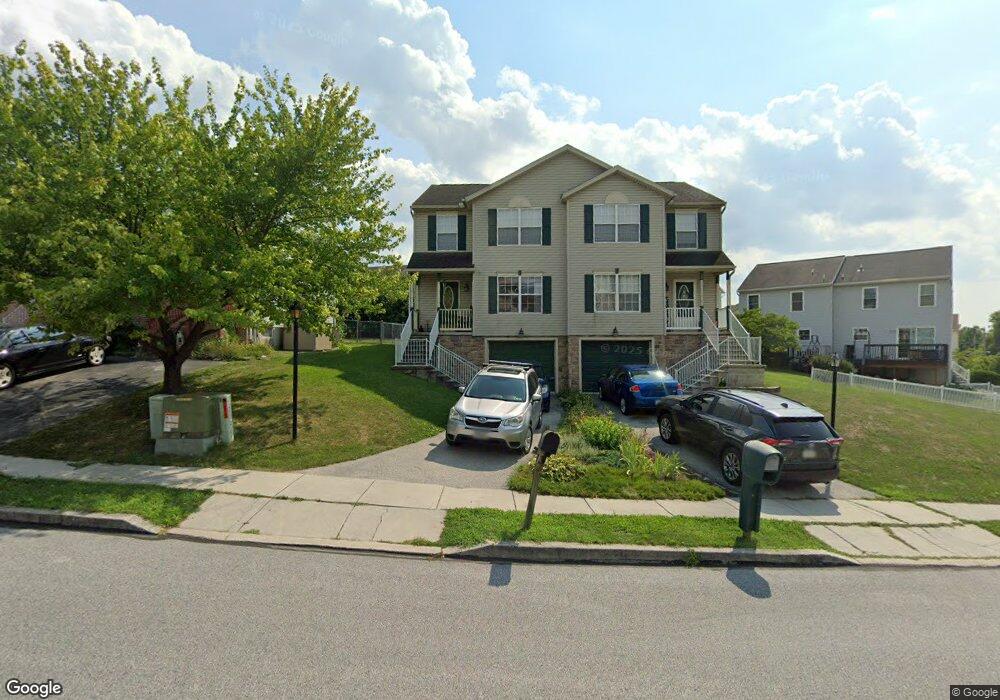
99 Bowman Rd Hanover, PA 17331
Estimated Value: $219,945 - $230,000
3
Beds
2
Baths
1,338
Sq Ft
$169/Sq Ft
Est. Value
About This Home
This home is located at 99 Bowman Rd, Hanover, PA 17331 and is currently estimated at $225,486, approximately $168 per square foot. 99 Bowman Rd is a home located in York County with nearby schools including South Western Senior High School and Delone Catholic High School.
Ownership History
Date
Name
Owned For
Owner Type
Purchase Details
Closed on
Jan 2, 2003
Sold by
Bon Ton Builders Inc
Bought by
Clark Dane J
Current Estimated Value
Home Financials for this Owner
Home Financials are based on the most recent Mortgage that was taken out on this home.
Original Mortgage
$97,750
Outstanding Balance
$41,884
Interest Rate
6.08%
Mortgage Type
Purchase Money Mortgage
Estimated Equity
$183,602
Purchase Details
Closed on
Jul 19, 1994
Bought by
Bon Ton Builders Inc
Create a Home Valuation Report for This Property
The Home Valuation Report is an in-depth analysis detailing your home's value as well as a comparison with similar homes in the area
Home Values in the Area
Average Home Value in this Area
Purchase History
| Date | Buyer | Sale Price | Title Company |
|---|---|---|---|
| Clark Dane J | $102,900 | -- | |
| Bon Ton Builders Inc | $155,000 | -- |
Source: Public Records
Mortgage History
| Date | Status | Borrower | Loan Amount |
|---|---|---|---|
| Open | Clark Dane J | $97,750 |
Source: Public Records
Tax History
| Year | Tax Paid | Tax Assessment Tax Assessment Total Assessment is a certain percentage of the fair market value that is determined by local assessors to be the total taxable value of land and additions on the property. | Land | Improvement |
|---|---|---|---|---|
| 2025 | $3,942 | $116,970 | $26,300 | $90,670 |
| 2024 | $3,942 | $116,970 | $26,300 | $90,670 |
| 2023 | $3,872 | $116,970 | $26,300 | $90,670 |
| 2022 | $3,789 | $116,970 | $26,300 | $90,670 |
| 2021 | $3,582 | $116,970 | $26,300 | $90,670 |
| 2020 | $3,582 | $116,970 | $26,300 | $90,670 |
| 2019 | $3,513 | $116,970 | $26,300 | $90,670 |
| 2018 | $3,466 | $116,970 | $26,300 | $90,670 |
| 2017 | $3,386 | $116,970 | $26,300 | $90,670 |
| 2016 | $0 | $116,970 | $26,300 | $90,670 |
| 2015 | -- | $116,970 | $26,300 | $90,670 |
| 2014 | -- | $116,970 | $26,300 | $90,670 |
Source: Public Records
Map
Nearby Homes
- 55 Wilmar Ave Unit 12
- 97 Overlook Dr
- 101 Overlook Dr
- 103 Overlook Dr
- 917 Baltimore St
- 421 Charles Ave
- 30 Brookside Ave
- 120 Charles Ave
- 206 Hall Dr
- 977 Baltimore St
- 116 Ruel Ave
- 538 York St
- 794 Barrett St
- 150 Mumma Ave
- 18 Beck Mill Rd
- 1280 Maple Ln Unit 10
- 414 S High St
- 146 Pleasant St
- 400 Ripple Dr Unit 56
- 139 Mussetta St
Your Personal Tour Guide
Ask me questions while you tour the home.