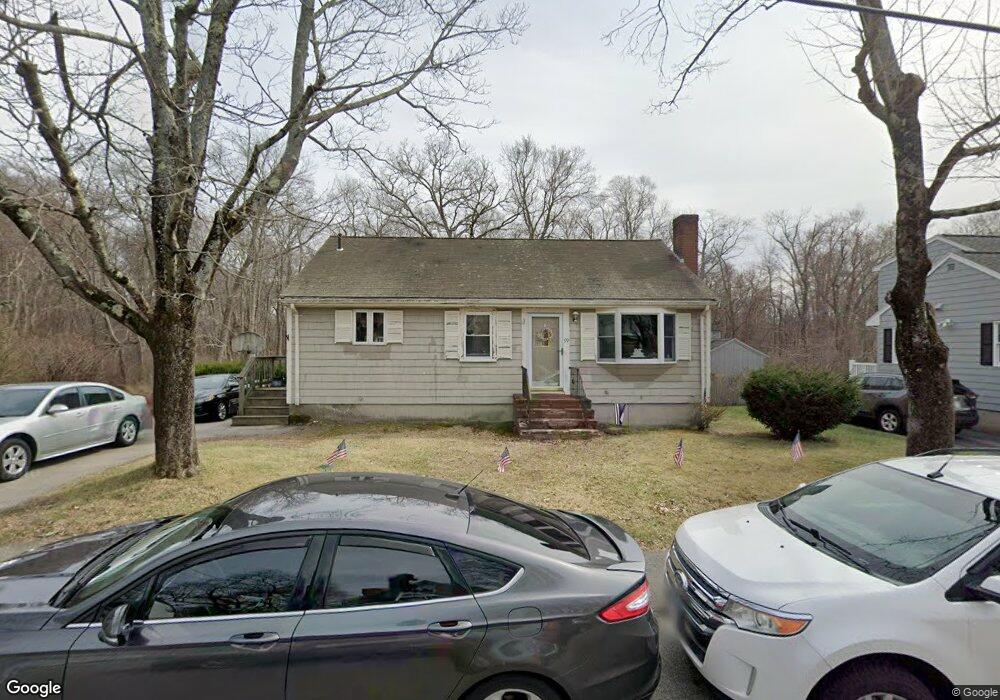
99 Chisholm Rd South Weymouth, MA 02190
Estimated Value: $544,000 - $711,000
3
Beds
1
Bath
900
Sq Ft
$671/Sq Ft
Est. Value
About This Home
This home is located at 99 Chisholm Rd, South Weymouth, MA 02190 and is currently estimated at $604,198, approximately $671 per square foot. 99 Chisholm Rd is a home located in Norfolk County with nearby schools including Ralph Talbot Primary School, Abigail Adams Middle School, and Weymouth Middle School Chapman.
Ownership History
Date
Name
Owned For
Owner Type
Purchase Details
Closed on
Feb 17, 1995
Sold by
Barry John J and Barry Lorraine E
Bought by
Boyle James J and Boyle Patricia K
Current Estimated Value
Home Financials for this Owner
Home Financials are based on the most recent Mortgage that was taken out on this home.
Original Mortgage
$125,100
Interest Rate
9.2%
Mortgage Type
Purchase Money Mortgage
Purchase Details
Closed on
Jan 3, 1995
Sold by
Barry John J and Barry Lorraine E
Bought by
Boyle James J and Boyle Patricia K
Home Financials for this Owner
Home Financials are based on the most recent Mortgage that was taken out on this home.
Original Mortgage
$125,100
Interest Rate
9.2%
Mortgage Type
Purchase Money Mortgage
Purchase Details
Closed on
Aug 4, 1994
Sold by
Nagle Anna B Est
Bought by
Barry John J and Barry Lorraine E
Create a Home Valuation Report for This Property
The Home Valuation Report is an in-depth analysis detailing your home's value as well as a comparison with similar homes in the area
Home Values in the Area
Average Home Value in this Area
Purchase History
| Date | Buyer | Sale Price | Title Company |
|---|---|---|---|
| Boyle James J | $139,000 | -- | |
| Boyle James J | $139,000 | -- | |
| Barry John J | $90,000 | -- |
Source: Public Records
Mortgage History
| Date | Status | Borrower | Loan Amount |
|---|---|---|---|
| Open | Barry John J | $50,000 | |
| Open | Barry John J | $124,000 | |
| Closed | Barry John J | $125,100 |
Source: Public Records
Tax History Compared to Growth
Tax History
| Year | Tax Paid | Tax Assessment Tax Assessment Total Assessment is a certain percentage of the fair market value that is determined by local assessors to be the total taxable value of land and additions on the property. | Land | Improvement |
|---|---|---|---|---|
| 2025 | $4,622 | $457,600 | $228,100 | $229,500 |
| 2024 | $4,527 | $440,800 | $217,300 | $223,500 |
| 2023 | $4,498 | $430,400 | $219,500 | $210,900 |
| 2022 | $4,452 | $388,500 | $203,200 | $185,300 |
| 2021 | $4,096 | $348,900 | $203,200 | $145,700 |
| 2020 | $3,872 | $324,800 | $203,200 | $121,600 |
| 2019 | $3,766 | $310,700 | $195,400 | $115,300 |
| 2018 | $3,663 | $293,000 | $186,100 | $106,900 |
| 2017 | $3,577 | $279,200 | $177,300 | $101,900 |
| 2016 | $3,436 | $268,400 | $170,400 | $98,000 |
| 2015 | $3,366 | $260,900 | $170,400 | $90,500 |
| 2014 | $3,273 | $246,100 | $158,600 | $87,500 |
Source: Public Records
Map
Nearby Homes
- 17 Sears Rd
- 45 Cherry Ln
- 41 Oak St
- 5 Oak St
- 26 Leahaven Rd
- 206 Pine St
- 11 White St
- 261 Pleasant St Unit 5
- 17 Buchanan Ln
- 120 Burkhall St Unit K
- 207 Central St
- 159 Tall Oaks Dr Unit D
- 121 Tall Oaks Dr Unit Q
- 45 Union St
- 200 Burkhall St Unit 803
- 200 Burkhall St Unit 103
- 32 Weaver Rd
- 197 White St
- 27 Park Ave
- 54 Old Quarry Dr