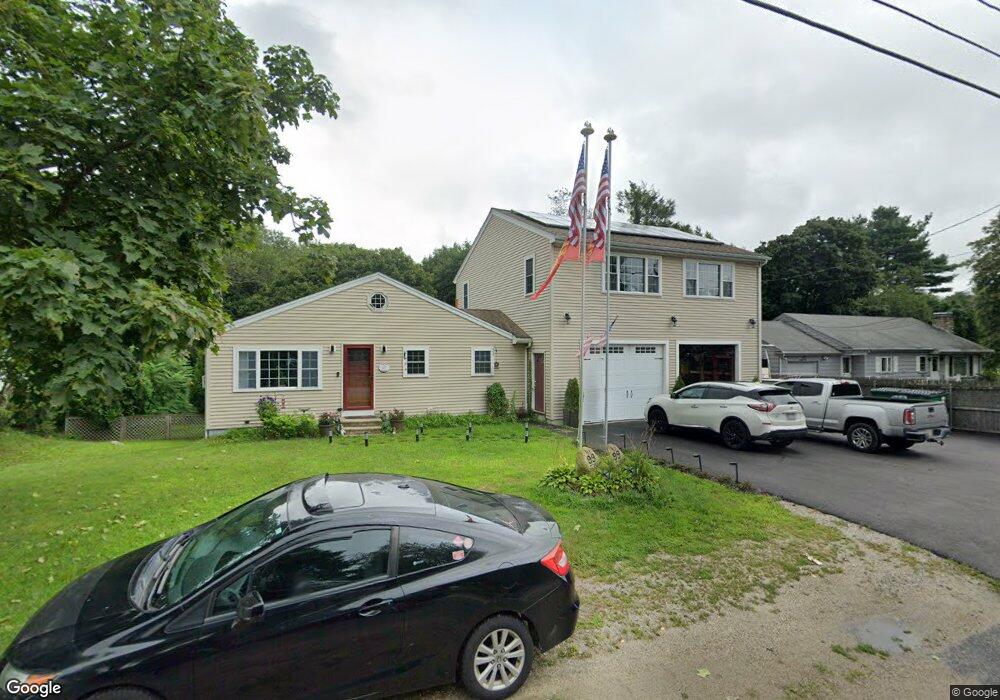
99 Davis Rd Westport, MA 02790
North Westport NeighborhoodEstimated Value: $546,599 - $636,000
3
Beds
3
Baths
2,116
Sq Ft
$285/Sq Ft
Est. Value
About This Home
This home is located at 99 Davis Rd, Westport, MA 02790 and is currently estimated at $602,150, approximately $284 per square foot. 99 Davis Rd is a home located in Bristol County with nearby schools including Alice A. Macomber Primary School, Westport Elementary School, and Westport Middle-High School.
Ownership History
Date
Name
Owned For
Owner Type
Purchase Details
Closed on
May 25, 2000
Sold by
Manghan Christopher A and Manghan Madeleine T
Bought by
Porawski Robert J and Porawski Lisa A
Current Estimated Value
Purchase Details
Closed on
Jan 14, 1998
Sold by
Samson Robert J and Samson Alphonse R
Bought by
Manghan Christopher A and Manghan Medeleine T
Purchase Details
Closed on
Nov 2, 1992
Sold by
Samson Roland A Est
Bought by
Sampson Robert J and Sampson Alphonse R
Create a Home Valuation Report for This Property
The Home Valuation Report is an in-depth analysis detailing your home's value as well as a comparison with similar homes in the area
Home Values in the Area
Average Home Value in this Area
Purchase History
| Date | Buyer | Sale Price | Title Company |
|---|---|---|---|
| Porawski Robert J | $145,000 | -- | |
| Manghan Christopher A | $110,000 | -- | |
| Sampson Robert J | $110,000 | -- |
Source: Public Records
Mortgage History
| Date | Status | Borrower | Loan Amount |
|---|---|---|---|
| Open | Sampson Robert J | $252,000 | |
| Closed | Sampson Robert J | $63,000 |
Source: Public Records
Tax History Compared to Growth
Tax History
| Year | Tax Paid | Tax Assessment Tax Assessment Total Assessment is a certain percentage of the fair market value that is determined by local assessors to be the total taxable value of land and additions on the property. | Land | Improvement |
|---|---|---|---|---|
| 2025 | $3,589 | $481,800 | $166,900 | $314,900 |
| 2024 | $3,357 | $434,300 | $148,200 | $286,100 |
| 2023 | $3,403 | $417,000 | $135,000 | $282,000 |
| 2022 | $2,689 | $335,300 | $135,000 | $200,300 |
| 2021 | $2,689 | $311,900 | $111,600 | $200,300 |
| 2020 | $2,591 | $307,400 | $107,100 | $200,300 |
| 2019 | $6,954 | $280,300 | $107,100 | $173,200 |
| 2018 | $2,498 | $305,700 | $115,300 | $190,400 |
| 2017 | $2,407 | $302,000 | $115,300 | $186,700 |
| 2016 | $2,253 | $284,800 | $115,300 | $169,500 |
| 2015 | $2,115 | $266,700 | $115,300 | $151,400 |
Source: Public Records
Map
Nearby Homes