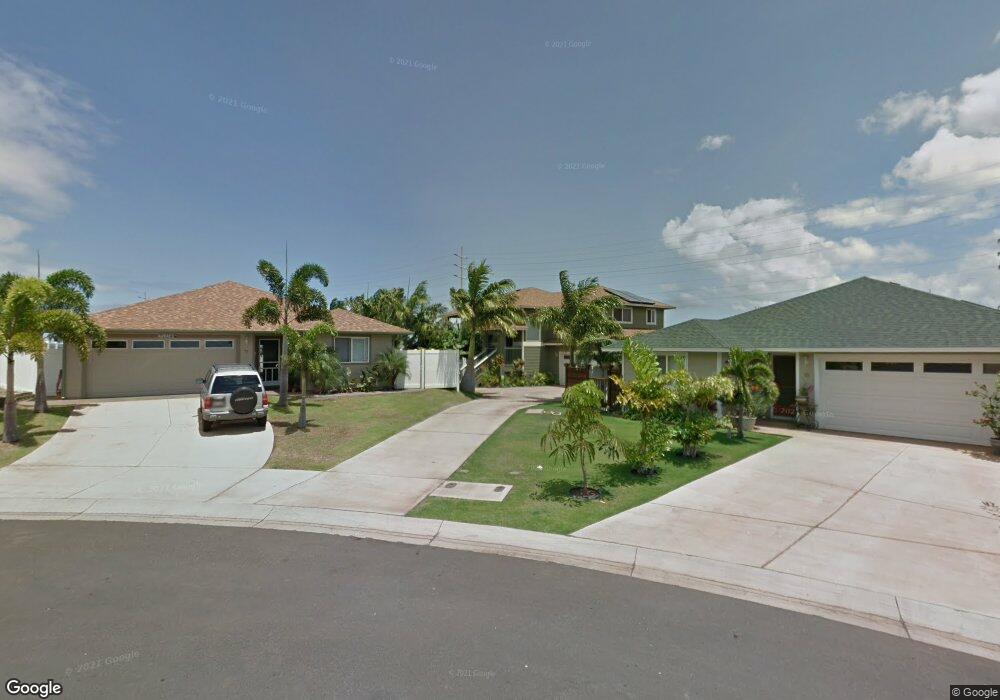
99 E Makaukau Loop Unit Lot 372 Wailuku, HI 96793
Estimated Value: $1,201,288 - $1,297,000
3
Beds
3
Baths
1,811
Sq Ft
$687/Sq Ft
Est. Value
About This Home
This home is located at 99 E Makaukau Loop Unit Lot 372, Wailuku, HI 96793 and is currently estimated at $1,244,572, approximately $687 per square foot. 99 E Makaukau Loop Unit Lot 372 is a home located in Maui County with nearby schools including Puu Kukui Elementary School, Maui Waena Intermediate School, and Maui High School.
Ownership History
Date
Name
Owned For
Owner Type
Purchase Details
Closed on
Aug 6, 2010
Sold by
Dykstra Jeffrey Wayne and Dykstra Cynthia Lynn
Bought by
Fujieda Garret Y and Fujieda Laurie F
Current Estimated Value
Home Financials for this Owner
Home Financials are based on the most recent Mortgage that was taken out on this home.
Original Mortgage
$394,400
Outstanding Balance
$260,472
Interest Rate
4.52%
Mortgage Type
New Conventional
Estimated Equity
$984,100
Purchase Details
Closed on
Jan 10, 2008
Sold by
Spencer Homes Inc
Bought by
Dykstra Jeffrey Wayne and Dykstra Cynthia Lynn
Home Financials for this Owner
Home Financials are based on the most recent Mortgage that was taken out on this home.
Original Mortgage
$335,177
Interest Rate
5.96%
Mortgage Type
Unknown
Create a Home Valuation Report for This Property
The Home Valuation Report is an in-depth analysis detailing your home's value as well as a comparison with similar homes in the area
Home Values in the Area
Average Home Value in this Area
Purchase History
| Date | Buyer | Sale Price | Title Company |
|---|---|---|---|
| Fujieda Garret Y | $493,000 | Fntic | |
| Dykstra Jeffrey Wayne | $478,800 | Tg |
Source: Public Records
Mortgage History
| Date | Status | Borrower | Loan Amount |
|---|---|---|---|
| Open | Fujieda Garret Y | $394,400 | |
| Previous Owner | Dykstra Jeffrey Wayne | $335,177 |
Source: Public Records
Tax History Compared to Growth
Tax History
| Year | Tax Paid | Tax Assessment Tax Assessment Total Assessment is a certain percentage of the fair market value that is determined by local assessors to be the total taxable value of land and additions on the property. | Land | Improvement |
|---|---|---|---|---|
| 2025 | $5,537 | $1,083,300 | $582,500 | $500,800 |
| 2024 | $5,537 | $943,300 | $466,000 | $477,300 |
| 2023 | $5,287 | $903,700 | $426,000 | $477,700 |
| 2022 | $4,549 | $777,600 | $344,200 | $433,400 |
| 2021 | $3,855 | $707,300 | $328,300 | $379,000 |
| 2020 | $3,837 | $704,000 | $317,700 | $386,300 |
| 2019 | $3,672 | $655,700 | $280,700 | $375,000 |
| 2018 | $3,407 | $617,200 | $217,100 | $400,100 |
| 2017 | $1,100 | $0 | $0 | $0 |
| 2016 | $996 | $568,900 | $201,200 | $367,700 |
| 2015 | $335 | $513,300 | $201,200 | $312,100 |
Source: Public Records
Map
Nearby Homes
- 159 Iniiniki St
- 801 Haawi St
- 80 Koani Loop
- 43 & 45 Moolu St
- 232 Kamahao Cir
- 24 Paa St Unit 53A
- 103 Moolu Cir Unit 103 Moolu
- 147 Moolu Cir
- 104 Maa St Unit Lot 29
- 302 Kama St
- 60 Wilikona Place
- 1520 Kilinoe Place
- 103 Unahe St Unit Lot 128-B
- 109 Unahe St Unit Lot 131-A
- 105 Unahe St Unit Lot 129A
- 93 Unahe St Unit Lot 125-B
- 101 Unahe St Unit Lot 127-B
- 97 Unahe St Unit Lot 126A
- 88 Unahe St Unit Lot 8
- 123 Unahe St Unit Lot 1
- 99 E Makaukau Loop
- 95 E Makaukau Loop
- 95 E Makaukau Loop Unit Lot 373
- 103 E Makaukau Loop
- 103 E Makaukau Loop Unit Lot 371
- 91 E Makaukau Loop
- 91 E Makaukau Loop Unit Lot 374
- 107 E Makaukau Loop
- 107 E Makaukau Loop Unit Lot 370
- 87 E Makaukau Loop
- 87 E Makaukau Loop Unit Lot 375
- 106 E Makaukau Loop
- 111 E Makaukau Loop
- 111 E Makaukau Loop Unit Lot 369
- 165 Pualalea Cir
- 110 E Makaukau Loop
- 169 Pualalea Cir
- 83 E Makaukau Loop
- 83 E Makaukau Loop Unit Lot 376
- 161 Pualalea Cir