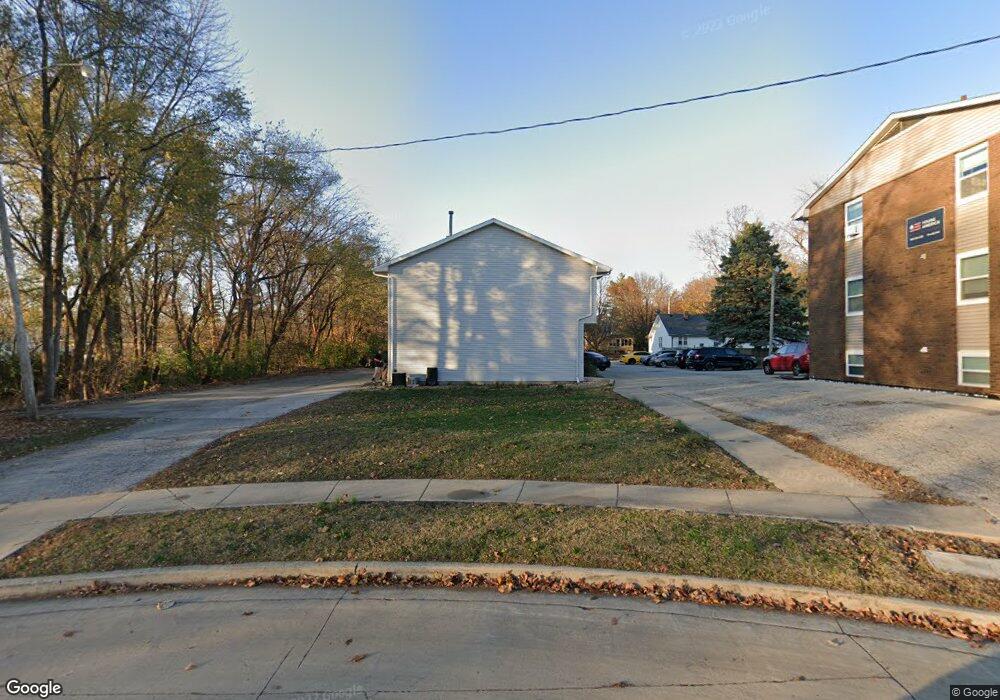
99 E Poplar St Normal, IL 61761
Fell Park NeighborhoodEstimated Value: $207,000 - $695,000
21
Beds
7
Baths
6,944
Sq Ft
$65/Sq Ft
Est. Value
About This Home
This home is located at 99 E Poplar St, Normal, IL 61761 and is currently estimated at $451,000, approximately $64 per square foot. 99 E Poplar St is a home located in McLean County with nearby schools including Glenn Elementary School, Kingsley Junior High School, and Normal Community West High School.
Ownership History
Date
Name
Owned For
Owner Type
Purchase Details
Closed on
Apr 30, 2025
Sold by
Mrm Property Investments Llc
Bought by
Tfi Llc
Current Estimated Value
Home Financials for this Owner
Home Financials are based on the most recent Mortgage that was taken out on this home.
Original Mortgage
$560,000
Outstanding Balance
$486,120
Interest Rate
5.89%
Mortgage Type
New Conventional
Estimated Equity
-$35,120
Purchase Details
Closed on
May 21, 2020
Sold by
Custom Leasing Llc
Bought by
Weston Properties Llc
Purchase Details
Closed on
Jul 31, 2008
Sold by
Rud Jamie J
Bought by
Custom Leasing Llc
Home Financials for this Owner
Home Financials are based on the most recent Mortgage that was taken out on this home.
Original Mortgage
$25,000
Interest Rate
6.5%
Purchase Details
Closed on
Sep 24, 2007
Sold by
Citizens First National Bank
Bought by
Rud Jamie J
Create a Home Valuation Report for This Property
The Home Valuation Report is an in-depth analysis detailing your home's value as well as a comparison with similar homes in the area
Home Values in the Area
Average Home Value in this Area
Purchase History
| Date | Buyer | Sale Price | Title Company |
|---|---|---|---|
| Tfi Llc | $672,000 | None Listed On Document | |
| Weston Properties Llc | -- | Attorney | |
| Custom Leasing Llc | $390,000 | None Available | |
| Rud Jamie J | -- | None Available |
Source: Public Records
Mortgage History
| Date | Status | Borrower | Loan Amount |
|---|---|---|---|
| Open | Tfi Llc | $560,000 | |
| Previous Owner | Custom Leasing Llc | $25,000 |
Source: Public Records
Tax History
| Year | Tax Paid | Tax Assessment Tax Assessment Total Assessment is a certain percentage of the fair market value that is determined by local assessors to be the total taxable value of land and additions on the property. | Land | Improvement |
|---|---|---|---|---|
| 2024 | $521 | $7,170 | $4,222 | $2,948 |
| 2022 | $521 | $5,800 | $3,415 | $2,385 |
| 2021 | $503 | $5,472 | $3,222 | $2,250 |
| 2020 | $501 | $5,416 | $3,189 | $2,227 |
| 2019 | $484 | $5,387 | $3,172 | $2,215 |
| 2018 | $478 | $5,330 | $3,138 | $2,192 |
| 2017 | $461 | $5,330 | $3,138 | $2,192 |
| 2016 | $456 | $5,330 | $3,138 | $2,192 |
| 2015 | $444 | $5,205 | $3,064 | $2,141 |
| 2014 | $438 | $5,205 | $3,064 | $2,141 |
| 2013 | -- | $5,205 | $3,064 | $2,141 |
Source: Public Records
Map
Nearby Homes
- 903 N Linden St Unit 108
- 605 Pine St Unit 18
- 8 University Ct
- 1003 Chippewa St
- 307 Belview Ave
- 450 Beechwood Ct
- 320 Basswood Ln
- 1211 Brentwood Ct
- 411 Orlando Ave
- 1504 Estate Dr
- 805 Dresser Dr
- 1204 Westview Dr
- 404 Grandview Dr
- 1609 Beech St Unit B
- 811 Phaeton Place
- 109 Suelynn Dr
- 907 S Fell Ave
- 1015 Sawgrass Dr
- 1316 Hanson Dr
- 1019 Sawgrass Dr
- 99 E Poplar St Unit 7
- 99 E Poplar St Unit 6
- 99 E Poplar St Unit 5
- 99 E Poplar St Unit 4
- 99 E Poplar St Unit 3
- 99 E Poplar St Unit 2
- 99 E Poplar St Unit 1
- 103 E Poplar St
- 97 W Poplar St
- 105 E Poplar St
- 102 E Cypress St
- 98 W Cypress St
- 99 W Poplar St
- 94 E Poplar St
- 100 W Cypress St
- 107 E Poplar St
- 101 W Poplar St
- 102 E Poplar St
- 98 W Poplar St
- 104 E Poplar St
Your Personal Tour Guide
Ask me questions while you tour the home.