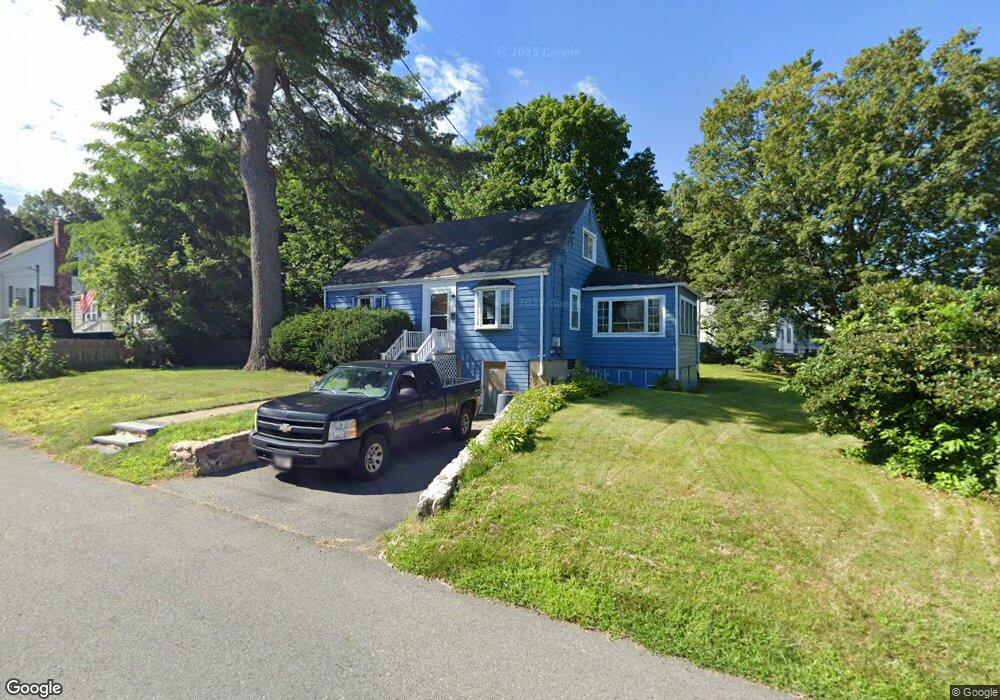
99 Eastern Ave Woburn, MA 01801
Downtown Woburn NeighborhoodEstimated Value: $587,000 - $745,000
3
Beds
1
Bath
1,382
Sq Ft
$487/Sq Ft
Est. Value
About This Home
This home is located at 99 Eastern Ave, Woburn, MA 01801 and is currently estimated at $673,290, approximately $487 per square foot. 99 Eastern Ave is a home located in Middlesex County with nearby schools including Shamrock Elementary School, Daniel L. Joyce Middle School, and Woburn High School.
Ownership History
Date
Name
Owned For
Owner Type
Purchase Details
Closed on
Aug 24, 2011
Sold by
Kane Martha M
Bought by
Fitzpatrick David Ep and Kane Daniel J
Current Estimated Value
Purchase Details
Closed on
Apr 1, 1986
Bought by
Kane Martha M
Create a Home Valuation Report for This Property
The Home Valuation Report is an in-depth analysis detailing your home's value as well as a comparison with similar homes in the area
Home Values in the Area
Average Home Value in this Area
Purchase History
| Date | Buyer | Sale Price | Title Company |
|---|---|---|---|
| Fitzpatrick David Ep | -- | -- | |
| Fitzpatrick David Ep | -- | -- | |
| Kane Martha M | $50,500 | -- |
Source: Public Records
Mortgage History
| Date | Status | Borrower | Loan Amount |
|---|---|---|---|
| Previous Owner | Kane Martha M | $52,000 | |
| Previous Owner | Kane Martha M | $55,200 |
Source: Public Records
Tax History
| Year | Tax Paid | Tax Assessment Tax Assessment Total Assessment is a certain percentage of the fair market value that is determined by local assessors to be the total taxable value of land and additions on the property. | Land | Improvement |
|---|---|---|---|---|
| 2025 | $4,598 | $538,400 | $285,100 | $253,300 |
| 2024 | $4,129 | $512,300 | $271,600 | $240,700 |
| 2023 | $4,044 | $464,800 | $246,900 | $217,900 |
| 2022 | $3,912 | $418,800 | $214,700 | $204,100 |
| 2021 | $3,683 | $394,800 | $204,400 | $190,400 |
| 2020 | $3,509 | $376,500 | $204,400 | $172,100 |
| 2019 | $3,423 | $360,300 | $194,700 | $165,600 |
| 2018 | $3,316 | $335,300 | $178,600 | $156,700 |
| 2017 | $3,102 | $312,100 | $170,200 | $141,900 |
| 2016 | $2,956 | $294,100 | $159,000 | $135,100 |
| 2015 | $2,838 | $279,100 | $148,600 | $130,500 |
| 2014 | $2,677 | $256,400 | $148,600 | $107,800 |
Source: Public Records
Map
Nearby Homes
- 0 Mount Pleasant St
- 14 Garfield Ave
- 28 Arlington St
- 35 Prospect St Unit 215
- 21 Eastern Ave
- 230 Main St Unit 4
- 6 Porter St
- 35 Montvale Ave Unit 8
- 9 Charles Rd
- 7 Prospect St
- 31 Montvale Ave Unit 2
- 15 Sturgis St
- 7 Conant Rd Unit 33
- 477 Main St
- 52 Pleasant St
- 8 Russell Rd Unit 10
- 27 Arlington Rd Unit 2
- 31 Arlington Rd Unit 1-6
- 171 Swanton St Unit 73
- 20 Arthur St
Your Personal Tour Guide
Ask me questions while you tour the home.