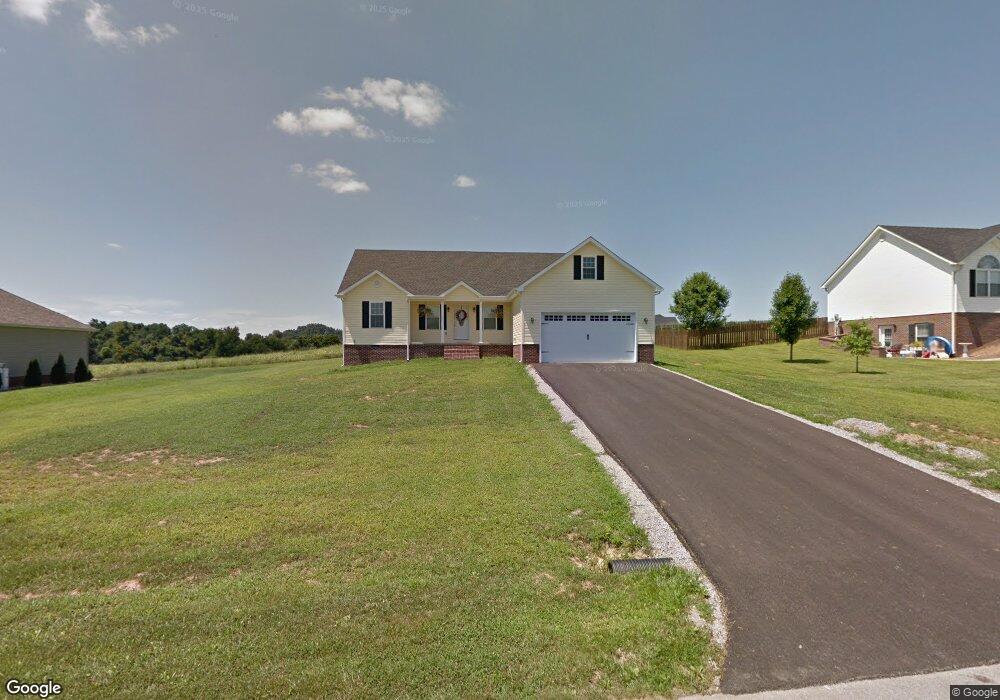
99 Elm Loop Hustonville, KY 40437
Estimated Value: $208,506 - $292,000
3
Beds
2
Baths
1,421
Sq Ft
$170/Sq Ft
Est. Value
About This Home
This home is located at 99 Elm Loop, Hustonville, KY 40437 and is currently estimated at $241,127, approximately $169 per square foot. 99 Elm Loop is a home located in Lincoln County with nearby schools including Lincoln County High School.
Ownership History
Date
Name
Owned For
Owner Type
Purchase Details
Closed on
Jun 11, 2014
Sold by
Kelsey Jordan E and Kelsey Jesslyn
Bought by
Goins Larry W and Goins Gladys R
Current Estimated Value
Home Financials for this Owner
Home Financials are based on the most recent Mortgage that was taken out on this home.
Original Mortgage
$72,900
Outstanding Balance
$55,621
Interest Rate
4.36%
Mortgage Type
VA
Estimated Equity
$185,506
Purchase Details
Closed on
Jun 24, 2012
Sold by
Griffin Elroy A and Griffin Patricia A
Bought by
Kelsey Jordan E and Long Jesslyn B
Create a Home Valuation Report for This Property
The Home Valuation Report is an in-depth analysis detailing your home's value as well as a comparison with similar homes in the area
Purchase History
| Date | Buyer | Sale Price | Title Company |
|---|---|---|---|
| Goins Larry W | $132,000 | None Available | |
| Kelsey Jordan E | $10,500 | None Available |
Source: Public Records
Mortgage History
| Date | Status | Borrower | Loan Amount |
|---|---|---|---|
| Open | Goins Larry W | $72,900 |
Source: Public Records
Tax History
| Year | Tax Paid | Tax Assessment Tax Assessment Total Assessment is a certain percentage of the fair market value that is determined by local assessors to be the total taxable value of land and additions on the property. | Land | Improvement |
|---|---|---|---|---|
| 2025 | $1,187 | $162,000 | $16,000 | $146,000 |
| 2024 | $12 | $162,000 | $16,000 | $146,000 |
| 2023 | $1,199 | $162,000 | $16,000 | $146,000 |
| 2022 | $1,262 | $162,000 | $16,000 | $146,000 |
| 2021 | $1,084 | $142,500 | $0 | $0 |
| 2020 | $1,122 | $142,500 | $0 | $0 |
| 2019 | $1,565 | $142,500 | $0 | $0 |
| 2018 | $1,549 | $142,500 | $0 | $0 |
| 2017 | $1,410 | $132,000 | $0 | $0 |
| 2016 | $1,410 | $132,000 | $0 | $0 |
| 2015 | -- | $132,000 | $0 | $0 |
| 2012 | -- | $10,500 | $10,500 | $0 |
Source: Public Records
Map
Nearby Homes
- 222 Elm Loop
- 5188 Us Highway 127
- 232 Griffin Ave
- 168 Master Ct
- 85 Amber Ln
- 198 Amber Ln
- 216 Raintree Cir
- 342 Masters Ct
- Lot 46 Griffin Ave
- 6376 State Highway 1194
- 120 Country Dr
- 10 Nelson Dr
- 175 Robin Dr
- 32 Eastgate Rd
- 90 Greg Dr
- 95 Lou Dr
- 4510 Kentucky 2141
- 000 US Highway 127
- 2475 Bowens Loop Rd
- 103 Austin Dr
Your Personal Tour Guide
Ask me questions while you tour the home.