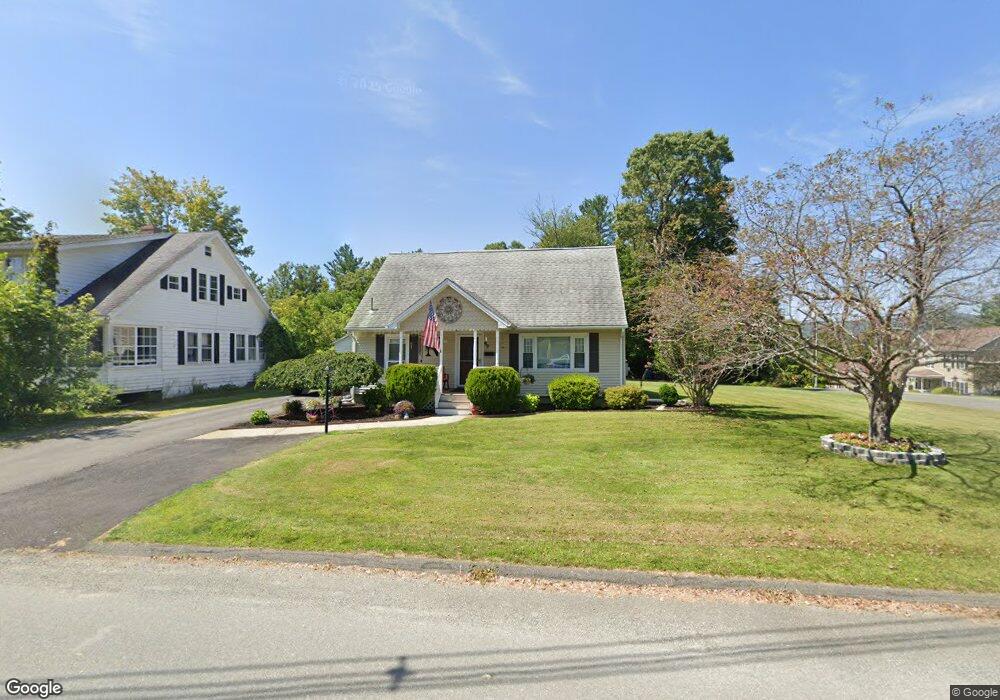
99 Essex St Pittsfield, MA 01201
Estimated Value: $254,000 - $299,000
3
Beds
1
Bath
1,326
Sq Ft
$209/Sq Ft
Est. Value
About This Home
This home is located at 99 Essex St, Pittsfield, MA 01201 and is currently estimated at $277,143, approximately $209 per square foot. 99 Essex St is a home located in Berkshire County with nearby schools including John T. Reid Middle School, Taconic High School, and Sinai Academy of the Berkshires.
Ownership History
Date
Name
Owned For
Owner Type
Purchase Details
Closed on
Sep 15, 2021
Sold by
Norton Ft and Kuni
Bought by
Norton Daniel A and Norton Jennifer L
Current Estimated Value
Purchase Details
Closed on
Aug 24, 2012
Sold by
Norton David A
Bought by
Norton Ft and Norton
Create a Home Valuation Report for This Property
The Home Valuation Report is an in-depth analysis detailing your home's value as well as a comparison with similar homes in the area
Home Values in the Area
Average Home Value in this Area
Purchase History
| Date | Buyer | Sale Price | Title Company |
|---|---|---|---|
| Norton Daniel A | -- | None Available | |
| Norton Daniel A | -- | None Available | |
| Norton Daniel A | -- | None Available | |
| Norton Ft | -- | -- | |
| Norton Ft | -- | -- | |
| Norton Ft | -- | -- |
Source: Public Records
Mortgage History
| Date | Status | Borrower | Loan Amount |
|---|---|---|---|
| Previous Owner | Norton Ft | $72,000 |
Source: Public Records
Tax History Compared to Growth
Tax History
| Year | Tax Paid | Tax Assessment Tax Assessment Total Assessment is a certain percentage of the fair market value that is determined by local assessors to be the total taxable value of land and additions on the property. | Land | Improvement |
|---|---|---|---|---|
| 2025 | $3,805 | $212,100 | $64,500 | $147,600 |
| 2024 | $3,627 | $196,600 | $64,500 | $132,100 |
| 2023 | $3,419 | $186,600 | $64,500 | $122,100 |
| 2022 | $3,168 | $170,700 | $64,500 | $106,200 |
| 2021 | $3,016 | $156,700 | $64,500 | $92,200 |
| 2020 | $2,771 | $140,600 | $51,600 | $89,000 |
| 2019 | $2,620 | $134,900 | $47,700 | $87,200 |
| 2018 | $2,635 | $131,700 | $47,700 | $84,000 |
| 2017 | $2,464 | $125,500 | $44,700 | $80,800 |
| 2016 | $2,347 | $125,100 | $44,700 | $80,400 |
| 2015 | $2,259 | $125,100 | $44,700 | $80,400 |
Source: Public Records
Map
Nearby Homes