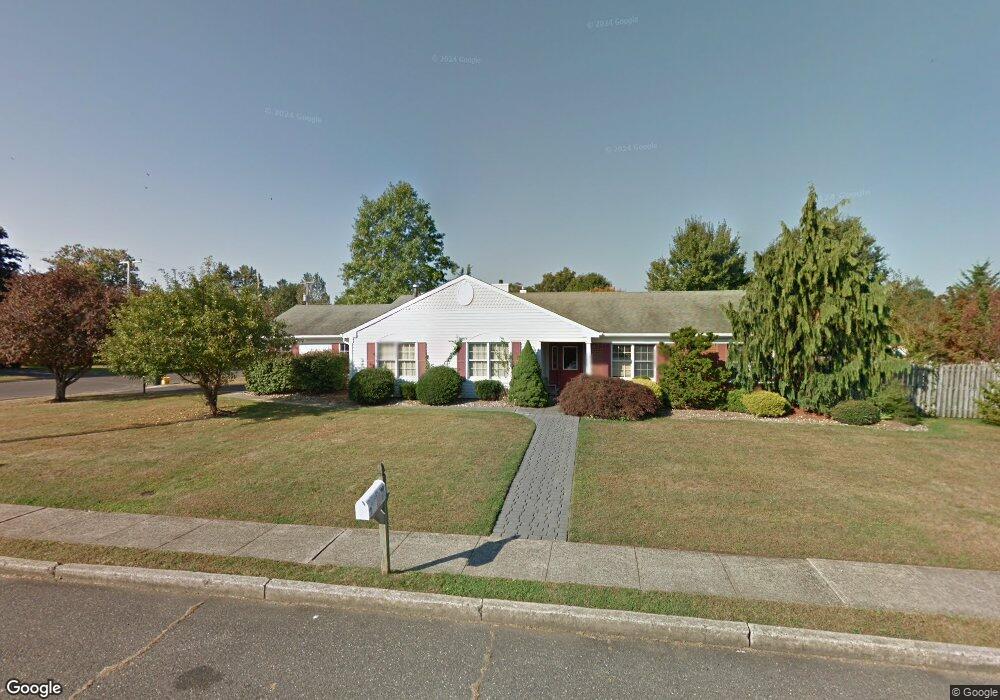
99 Forest St West Long Branch, NJ 07764
Estimated Value: $749,000 - $816,000
3
Beds
2
Baths
1,760
Sq Ft
$448/Sq Ft
Est. Value
About This Home
This home is located at 99 Forest St, West Long Branch, NJ 07764 and is currently estimated at $787,740, approximately $447 per square foot. 99 Forest St is a home located in Monmouth County with nearby schools including Betty McElmon Elementary School, Frank Antonides School, and Shore Regional High School.
Ownership History
Date
Name
Owned For
Owner Type
Purchase Details
Closed on
Sep 3, 2004
Sold by
Pearson Rebecca
Bought by
Siegel Mark
Current Estimated Value
Home Financials for this Owner
Home Financials are based on the most recent Mortgage that was taken out on this home.
Original Mortgage
$341,000
Outstanding Balance
$169,052
Interest Rate
5.89%
Estimated Equity
$618,688
Purchase Details
Closed on
Jan 28, 1994
Sold by
Scholl Joseph
Bought by
Miller Karl and Miller Rebecca
Home Financials for this Owner
Home Financials are based on the most recent Mortgage that was taken out on this home.
Original Mortgage
$164,000
Interest Rate
7.08%
Create a Home Valuation Report for This Property
The Home Valuation Report is an in-depth analysis detailing your home's value as well as a comparison with similar homes in the area
Home Values in the Area
Average Home Value in this Area
Purchase History
| Date | Buyer | Sale Price | Title Company |
|---|---|---|---|
| Siegel Mark | $429,900 | -- | |
| Miller Karl | $205,000 | -- |
Source: Public Records
Mortgage History
| Date | Status | Borrower | Loan Amount |
|---|---|---|---|
| Open | Siegel Mark | $341,000 | |
| Previous Owner | Miller Karl | $164,000 |
Source: Public Records
Tax History Compared to Growth
Tax History
| Year | Tax Paid | Tax Assessment Tax Assessment Total Assessment is a certain percentage of the fair market value that is determined by local assessors to be the total taxable value of land and additions on the property. | Land | Improvement |
|---|---|---|---|---|
| 2025 | $9,078 | $802,700 | $524,300 | $278,400 |
| 2024 | $9,569 | $696,700 | $456,100 | $240,600 |
| 2023 | $9,569 | $685,000 | $450,000 | $235,000 |
| 2022 | $6,636 | $548,800 | $325,000 | $223,800 |
| 2021 | $6,636 | $453,900 | $275,000 | $178,900 |
| 2020 | $8,847 | $430,500 | $240,000 | $190,500 |
| 2019 | $8,777 | $429,400 | $240,000 | $189,400 |
| 2018 | $8,900 | $420,600 | $240,000 | $180,600 |
| 2017 | $8,977 | $405,100 | $230,000 | $175,100 |
| 2016 | $8,221 | $378,500 | $235,000 | $143,500 |
| 2015 | $8,485 | $390,100 | $235,000 | $155,100 |
| 2014 | $7,643 | $327,900 | $180,000 | $147,900 |
Source: Public Records
Map
Nearby Homes