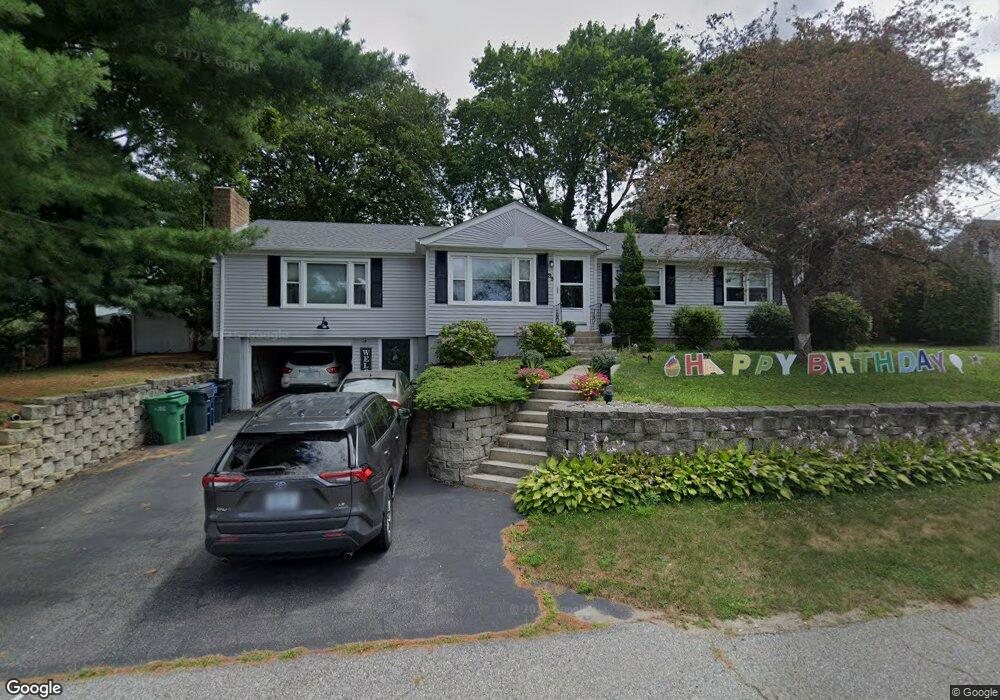
99 Fostmere Ct Warwick, RI 02889
Warwick Neck NeighborhoodEstimated Value: $502,000 - $576,000
3
Beds
2
Baths
1,676
Sq Ft
$317/Sq Ft
Est. Value
About This Home
This home is located at 99 Fostmere Ct, Warwick, RI 02889 and is currently estimated at $531,615, approximately $317 per square foot. 99 Fostmere Ct is a home located in Kent County with nearby schools including Saint Kevin School and Bishop Hendricken High School.
Ownership History
Date
Name
Owned For
Owner Type
Purchase Details
Closed on
Nov 6, 2009
Sold by
Caron Jane C and Caron Lee D
Bought by
Fitzgerald James M and Fitzgerald Kathleen B
Current Estimated Value
Home Financials for this Owner
Home Financials are based on the most recent Mortgage that was taken out on this home.
Original Mortgage
$225,834
Outstanding Balance
$146,716
Interest Rate
5.06%
Mortgage Type
Purchase Money Mortgage
Estimated Equity
$384,899
Create a Home Valuation Report for This Property
The Home Valuation Report is an in-depth analysis detailing your home's value as well as a comparison with similar homes in the area
Home Values in the Area
Average Home Value in this Area
Purchase History
| Date | Buyer | Sale Price | Title Company |
|---|---|---|---|
| Fitzgerald James M | $230,000 | -- |
Source: Public Records
Mortgage History
| Date | Status | Borrower | Loan Amount |
|---|---|---|---|
| Open | Fitzgerald James M | $225,834 | |
| Previous Owner | Fitzgerald James M | $25,000 | |
| Previous Owner | Fitzgerald James M | $77,000 |
Source: Public Records
Tax History Compared to Growth
Tax History
| Year | Tax Paid | Tax Assessment Tax Assessment Total Assessment is a certain percentage of the fair market value that is determined by local assessors to be the total taxable value of land and additions on the property. | Land | Improvement |
|---|---|---|---|---|
| 2025 | $6,109 | $481,000 | $145,700 | $335,300 |
| 2024 | $6,164 | $426,000 | $134,100 | $291,900 |
| 2023 | $6,045 | $426,000 | $134,100 | $291,900 |
| 2022 | $5,666 | $302,500 | $81,800 | $220,700 |
| 2021 | $5,666 | $302,500 | $81,800 | $220,700 |
| 2020 | $5,666 | $302,500 | $81,800 | $220,700 |
| 2019 | $5,666 | $302,500 | $81,800 | $220,700 |
| 2018 | $5,188 | $249,400 | $81,800 | $167,600 |
| 2017 | $5,048 | $249,400 | $81,800 | $167,600 |
| 2016 | $5,048 | $249,400 | $81,800 | $167,600 |
| 2015 | $4,497 | $216,700 | $73,400 | $143,300 |
| 2014 | $4,347 | $216,700 | $73,400 | $143,300 |
| 2013 | $4,288 | $216,700 | $73,400 | $143,300 |
Source: Public Records
Map
Nearby Homes
- 30 White Rock Rd
- 155 Lewiston St
- 100 Paine St
- 82 Barton Ave
- 0 Channing St
- 612 Warwick Neck Ave
- 0 Paine St
- 76 Medford St
- 66 Medford St
- 175 Randall Ave
- 159 Aldrich Ave
- 320 Palmer Ave
- 81 Fairhaven Ave
- 140 Alden Ave
- 19 Curtis St
- 90 Huron St
- 55 Brinton Ave
- 28 Lighthouse Ln
- 117 Second Point Rd
- 52 Uncas St
- 89 Fostmere Ct
- 111 Fostmere Ct
- 25 Fostmere Ct
- 98 Fostmere Ct
- 35 Fostmere Ct
- 15 Fostmere Ct
- 30 Fostmere Ct
- 108 Fostmere Ct
- 88 Fostmere Ct
- 79 Fostmere Ct
- 45 Fostmere Ct
- 78 Fostmere Ct
- 118 Fostmere Ct
- 64 Leroy Ave
- 76 Carlton Ave
- 45 White Rock Rd
- 66 Carlton Ave
- 96 Leroy Ave
- 20 Fostmere Ct
- 68 Fostmere Ct