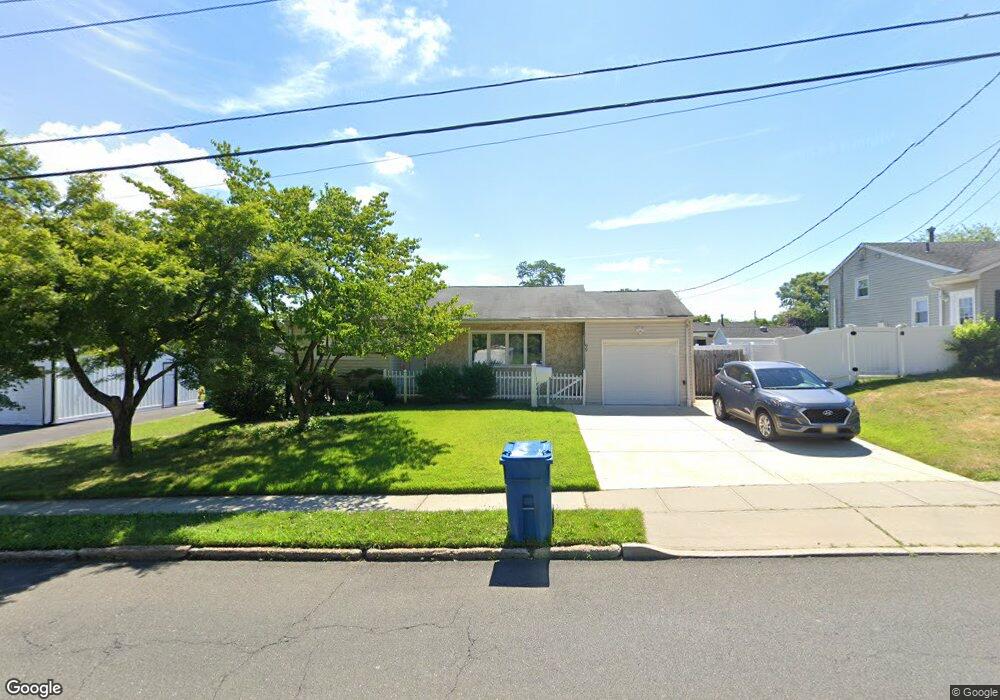
99 Hazlet Ave Hazlet, NJ 07730
Estimated Value: $456,000 - $538,000
3
Beds
1
Bath
1,030
Sq Ft
$479/Sq Ft
Est. Value
About This Home
This home is located at 99 Hazlet Ave, Hazlet, NJ 07730 and is currently estimated at $493,530, approximately $479 per square foot. 99 Hazlet Ave is a home located in Monmouth County with nearby schools including Raritan High School, St Benedict School, and St. John Vianney Regional High School.
Ownership History
Date
Name
Owned For
Owner Type
Purchase Details
Closed on
May 29, 2012
Sold by
Cardoza Christopher and Cardoza Donna
Bought by
Cordoza Christopher
Current Estimated Value
Purchase Details
Closed on
Jan 14, 2000
Sold by
Dc Reilly Associates
Bought by
Cordoza Christopher and Cordoza Donna
Home Financials for this Owner
Home Financials are based on the most recent Mortgage that was taken out on this home.
Original Mortgage
$146,200
Outstanding Balance
$47,395
Interest Rate
8.11%
Estimated Equity
$446,135
Create a Home Valuation Report for This Property
The Home Valuation Report is an in-depth analysis detailing your home's value as well as a comparison with similar homes in the area
Home Values in the Area
Average Home Value in this Area
Purchase History
| Date | Buyer | Sale Price | Title Company |
|---|---|---|---|
| Cordoza Christopher | -- | None Available | |
| Cordoza Christopher | $162,500 | -- |
Source: Public Records
Mortgage History
| Date | Status | Borrower | Loan Amount |
|---|---|---|---|
| Open | Cordoza Christopher | $146,200 |
Source: Public Records
Tax History Compared to Growth
Tax History
| Year | Tax Paid | Tax Assessment Tax Assessment Total Assessment is a certain percentage of the fair market value that is determined by local assessors to be the total taxable value of land and additions on the property. | Land | Improvement |
|---|---|---|---|---|
| 2025 | $8,460 | $437,100 | $258,400 | $178,700 |
| 2024 | $8,328 | $402,300 | $224,400 | $177,900 |
| 2023 | $8,328 | $389,700 | $213,400 | $176,300 |
| 2022 | $7,657 | $327,200 | $171,900 | $155,300 |
| 2021 | $7,657 | $298,500 | $160,400 | $138,100 |
| 2020 | $7,524 | $291,400 | $156,400 | $135,000 |
| 2019 | $7,281 | $277,600 | $143,400 | $134,200 |
| 2018 | $7,046 | $266,400 | $138,400 | $128,000 |
| 2017 | $6,724 | $254,200 | $130,100 | $124,100 |
| 2016 | $6,614 | $251,000 | $130,100 | $120,900 |
| 2015 | $6,515 | $247,900 | $130,100 | $117,800 |
| 2014 | $6,187 | $220,800 | $108,400 | $112,400 |
Source: Public Records
Map
Nearby Homes
- 1 Boyd Rd
- 642 Holmdel Rd
- 52 Monique Cir
- 16 Moak Dr
- 59 Ron Rd
- 127 Lane b
- 156 Lane b
- 11 Chestnut Ridge Rd
- 11 Lammers St
- 7 Kaylen Place
- 239 Lane c
- 627 Beers St
- 544 Lane F
- 672 N Beers St
- 1 Panagias Astadiotissis Agios Theodoros
- 118 Village Green Way
- 3 Duke Ln
- 29 Telegraph Hill Rd
- 748 Holmdel Rd
- 47 Village Green Way