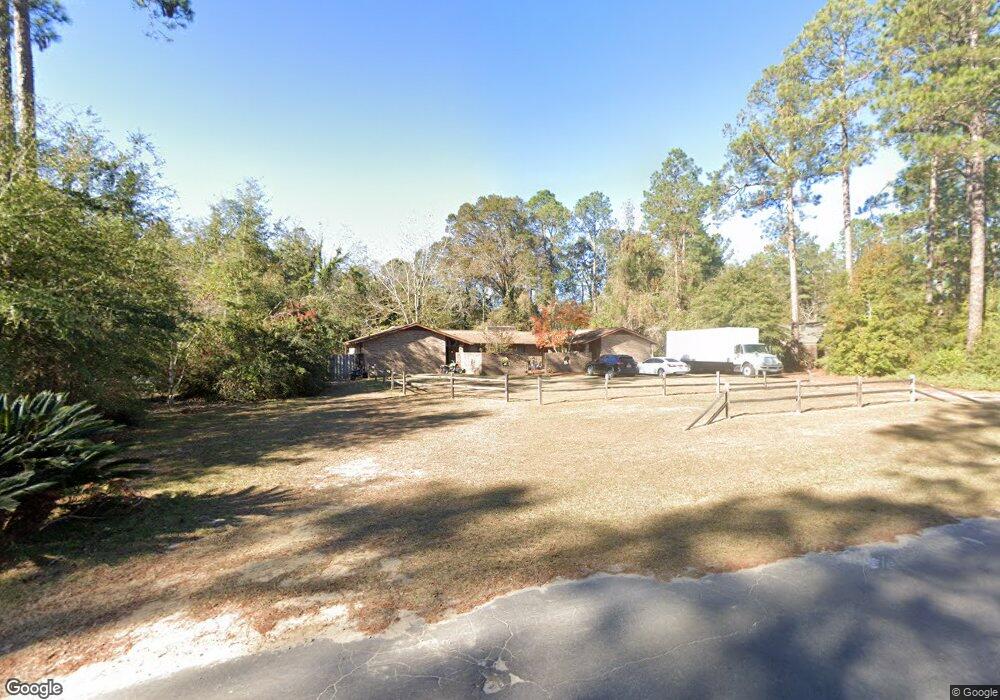
99 Holly Rd Unit CAMELIA DR. Sylvania, GA 30467
Estimated Value: $226,000 - $296,000
--
Bed
4
Baths
2,995
Sq Ft
$90/Sq Ft
Est. Value
About This Home
This home is located at 99 Holly Rd Unit CAMELIA DR., Sylvania, GA 30467 and is currently estimated at $268,956, approximately $89 per square foot. 99 Holly Rd Unit CAMELIA DR. is a home located in Screven County with nearby schools including Screven County Elementary School, Screven County Middle School, and Screven County High School.
Ownership History
Date
Name
Owned For
Owner Type
Purchase Details
Closed on
Mar 4, 2024
Sold by
Mcmillan Mccauley Connie
Bought by
Hogan Jeffory B and Hogan Misty O
Current Estimated Value
Home Financials for this Owner
Home Financials are based on the most recent Mortgage that was taken out on this home.
Original Mortgage
$282,955
Outstanding Balance
$278,249
Interest Rate
6.63%
Mortgage Type
New Conventional
Estimated Equity
-$9,293
Purchase Details
Closed on
Nov 29, 2016
Sold by
Roe William R
Bought by
Roe Connie M
Purchase Details
Closed on
May 28, 2008
Sold by
Fortner Jeannine Payne
Bought by
Roe William R
Purchase Details
Closed on
Nov 11, 2005
Sold by
Fortner Jimmy Robert
Bought by
Fortner Jeannine P
Purchase Details
Closed on
Oct 29, 1976
Sold by
Stradling Wm H
Bought by
Fortner James R
Create a Home Valuation Report for This Property
The Home Valuation Report is an in-depth analysis detailing your home's value as well as a comparison with similar homes in the area
Home Values in the Area
Average Home Value in this Area
Purchase History
| Date | Buyer | Sale Price | Title Company |
|---|---|---|---|
| Hogan Jeffory B | $277,000 | -- | |
| Roe Connie M | -- | -- | |
| Roe William R | $187,000 | -- | |
| Fortner Jeannine P | -- | -- | |
| Fortner James R | $3,500 | -- |
Source: Public Records
Mortgage History
| Date | Status | Borrower | Loan Amount |
|---|---|---|---|
| Open | Hogan Jeffory B | $282,955 |
Source: Public Records
Tax History Compared to Growth
Tax History
| Year | Tax Paid | Tax Assessment Tax Assessment Total Assessment is a certain percentage of the fair market value that is determined by local assessors to be the total taxable value of land and additions on the property. | Land | Improvement |
|---|---|---|---|---|
| 2024 | $2,935 | $90,280 | $5,280 | $85,000 |
| 2023 | $3,039 | $90,280 | $5,280 | $85,000 |
| 2022 | $2,715 | $80,840 | $5,280 | $75,560 |
| 2021 | $2,602 | $73,480 | $5,280 | $68,200 |
| 2020 | $2,556 | $69,800 | $5,280 | $64,520 |
| 2019 | $2,646 | $70,760 | $5,280 | $65,480 |
| 2018 | $2,445 | $69,600 | $5,280 | $64,320 |
| 2017 | $2,445 | $69,600 | $5,280 | $64,320 |
| 2016 | $2,556 | $69,680 | $5,280 | $64,400 |
| 2015 | -- | $68,360 | $5,280 | $63,080 |
| 2014 | -- | $66,880 | $5,280 | $61,600 |
| 2013 | -- | $67,800 | $5,280 | $62,520 |
Source: Public Records
Map
Nearby Homes
- 611 W Ogeechee St
- 208 Wildwood Dr
- 104 Wildwood St
- 112 Cail St
- 814 S Main St
- 0 Halcyondale Rd Unit SA331612
- 0 Halcyondale Rd Unit 10536056
- 103 Live Oak Rd
- 123 Hiers Ave
- 207 Georgia Ave
- 221 N Main Streets
- 0 Runs Branch Rd Unit 10617232
- 406 N Main St
- 501 N Main St
- 222 Bridgeton Dr
- 416 Abram St
- 0 Dune Ln Unit SA331767
- 0 Industrial Park Rd Unit 19161353
- 850 Buttermilk Rd
- 184 Sawgrass Rd