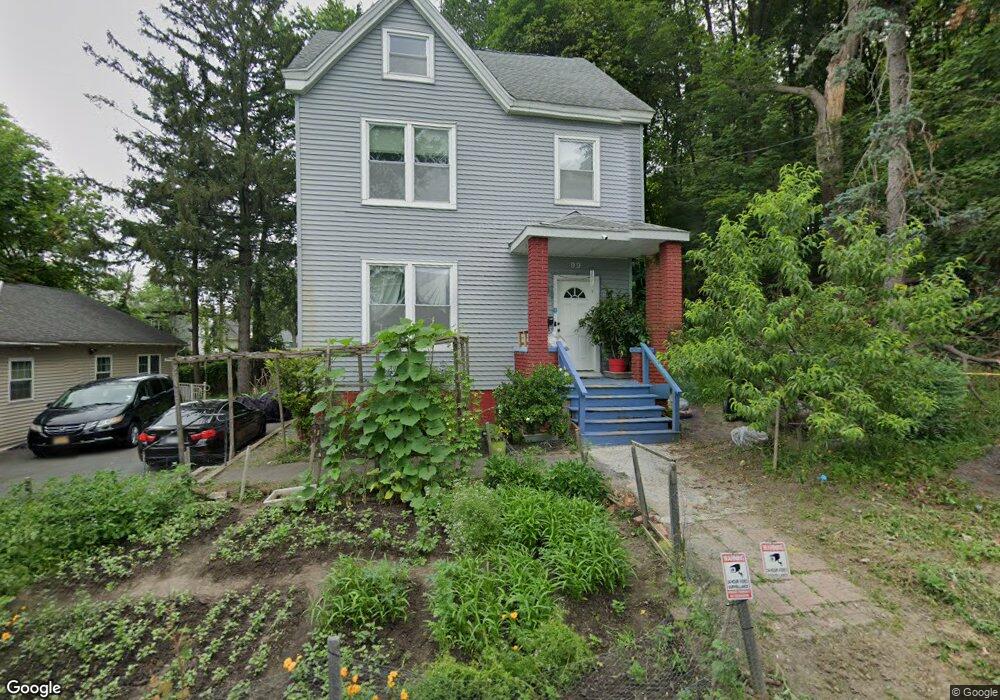
99 Ingalls Ave Troy, NY 12180
North Central NeighborhoodEstimated Value: $228,706 - $260,000
3
Beds
2
Baths
1,512
Sq Ft
$163/Sq Ft
Est. Value
About This Home
This home is located at 99 Ingalls Ave, Troy, NY 12180 and is currently estimated at $246,427, approximately $162 per square foot. 99 Ingalls Ave is a home located in Rensselaer County with nearby schools including P.S. 2, W. Kenneth Doyle Middle School, and Troy High School.
Ownership History
Date
Name
Owned For
Owner Type
Purchase Details
Closed on
Apr 4, 2012
Sold by
Habitat For Humanity Of Rensselaer County Inc
Bought by
Noing Maung Thein
Current Estimated Value
Home Financials for this Owner
Home Financials are based on the most recent Mortgage that was taken out on this home.
Original Mortgage
$45,000
Outstanding Balance
$31,193
Interest Rate
3.91%
Mortgage Type
Unknown
Estimated Equity
$215,234
Purchase Details
Closed on
Apr 13, 2009
Sold by
Trustee Wells Fargo Bank
Bought by
Habitat For Humanity Of Rensselaer County Inc
Purchase Details
Closed on
Sep 18, 2008
Sold by
Tobin Patricia Marie
Bought by
Wells Fargo Bank Na
Purchase Details
Closed on
Jan 26, 2000
Purchase Details
Closed on
Jan 21, 2000
Create a Home Valuation Report for This Property
The Home Valuation Report is an in-depth analysis detailing your home's value as well as a comparison with similar homes in the area
Home Values in the Area
Average Home Value in this Area
Purchase History
| Date | Buyer | Sale Price | Title Company |
|---|---|---|---|
| Noing Maung Thein | $125,000 | Scott Morley | |
| Habitat For Humanity Of Rensselaer County Inc | $2,500 | Kileen Davies | |
| Wells Fargo Bank Na | $48,223 | Fein Such & Crane, Llp | |
| -- | -- | -- | |
| -- | -- | -- |
Source: Public Records
Mortgage History
| Date | Status | Borrower | Loan Amount |
|---|---|---|---|
| Open | Noing Maung Thein | $45,000 | |
| Closed | Noing Maung Thein | $15,000 |
Source: Public Records
Tax History Compared to Growth
Tax History
| Year | Tax Paid | Tax Assessment Tax Assessment Total Assessment is a certain percentage of the fair market value that is determined by local assessors to be the total taxable value of land and additions on the property. | Land | Improvement |
|---|---|---|---|---|
| 2024 | $5,300 | $125,000 | $11,000 | $114,000 |
| 2023 | $5,298 | $125,000 | $11,000 | $114,000 |
| 2022 | $5,055 | $125,000 | $11,000 | $114,000 |
| 2021 | $1,423 | $125,000 | $11,000 | $114,000 |
| 2020 | $2,244 | $125,000 | $11,000 | $114,000 |
| 2019 | $3,453 | $125,000 | $11,000 | $114,000 |
| 2018 | $3,453 | $125,000 | $11,000 | $114,000 |
| 2017 | $3,447 | $125,000 | $11,000 | $114,000 |
| 2016 | $4,769 | $125,000 | $11,000 | $114,000 |
| 2015 | -- | $125,000 | $11,000 | $114,000 |
| 2014 | -- | $125,000 | $11,000 | $114,000 |
Source: Public Records
Map
Nearby Homes