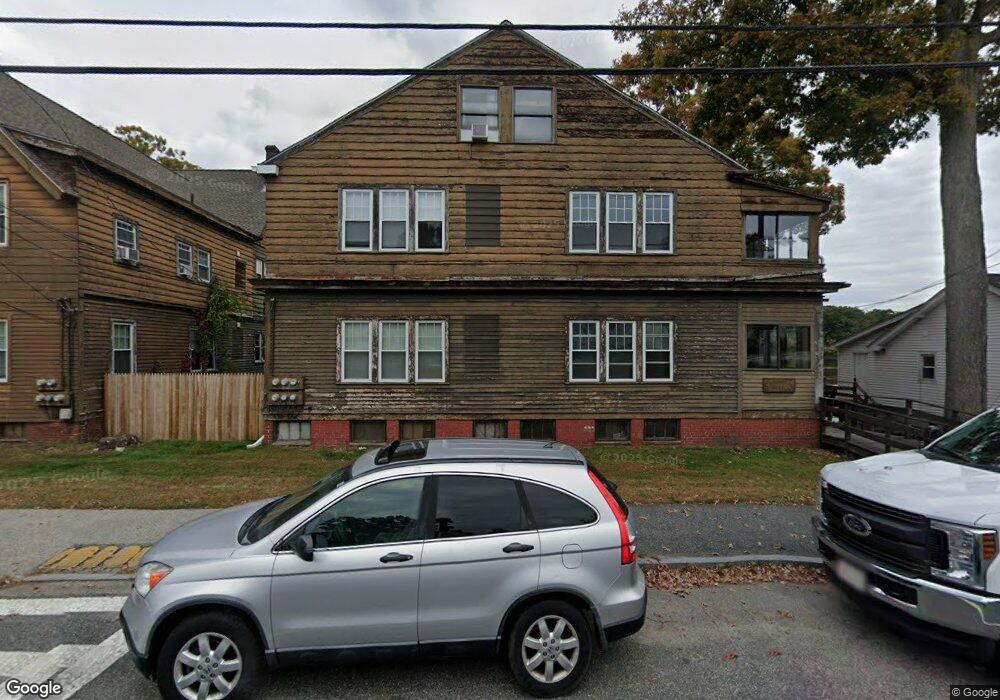
99 Lake Ave N Worcester, MA 01605
Estimated Value: $451,000 - $555,000
3
Beds
2
Baths
2,195
Sq Ft
$234/Sq Ft
Est. Value
About This Home
This home is located at 99 Lake Ave N, Worcester, MA 01605 and is currently estimated at $512,568, approximately $233 per square foot. 99 Lake Ave N is a home located in Worcester County with nearby schools including Jacob Hiatt Magnet School, Chandler Magnet, and Lake View Elementary School.
Ownership History
Date
Name
Owned For
Owner Type
Purchase Details
Closed on
Apr 22, 2022
Sold by
Aragam Jayashri and Aragam Gopalakrishna K
Bought by
Aragam Jayashri and Aragam Gopalakrishna K
Current Estimated Value
Purchase Details
Closed on
Jan 28, 2020
Sold by
Aragam Gowri G
Bought by
Aragam Jayashri R and Aragam Gopalakrishn K
Home Financials for this Owner
Home Financials are based on the most recent Mortgage that was taken out on this home.
Original Mortgage
$170,000
Interest Rate
3.72%
Mortgage Type
New Conventional
Purchase Details
Closed on
Aug 4, 2010
Sold by
Saksena Shiva
Bought by
Aragam Jayashri and Aragam Gopalakrishn
Home Financials for this Owner
Home Financials are based on the most recent Mortgage that was taken out on this home.
Original Mortgage
$207,209
Interest Rate
4.73%
Mortgage Type
Purchase Money Mortgage
Purchase Details
Closed on
Feb 18, 1998
Sold by
Saleba Paul
Bought by
Saksena Shiva and Saksena In Fai Nancy
Create a Home Valuation Report for This Property
The Home Valuation Report is an in-depth analysis detailing your home's value as well as a comparison with similar homes in the area
Purchase History
| Date | Buyer | Sale Price | Title Company |
|---|---|---|---|
| Aragam Jayashri | -- | None Available | |
| Aragam Jayashri R | -- | Metropolitan Title Agency | |
| Aragam Jayashri | $210,000 | -- | |
| Aragam Jayashri R | $210,000 | -- | |
| Saksena Shiva | $125,000 | -- |
Source: Public Records
Mortgage History
| Date | Status | Borrower | Loan Amount |
|---|---|---|---|
| Previous Owner | Aragam Jayashri R | $170,000 | |
| Previous Owner | Aragam Jayashri R | $207,209 |
Source: Public Records
Tax History
| Year | Tax Paid | Tax Assessment Tax Assessment Total Assessment is a certain percentage of the fair market value that is determined by local assessors to be the total taxable value of land and additions on the property. | Land | Improvement |
|---|---|---|---|---|
| 2025 | $5,465 | $414,300 | $101,000 | $313,300 |
| 2024 | $5,177 | $376,500 | $101,000 | $275,500 |
| 2023 | $4,901 | $341,800 | $87,000 | $254,800 |
| 2022 | $4,492 | $295,300 | $69,600 | $225,700 |
| 2021 | $4,313 | $264,900 | $55,700 | $209,200 |
| 2020 | $4,201 | $247,100 | $55,600 | $191,500 |
| 2019 | $4,259 | $236,600 | $53,500 | $183,100 |
| 2018 | $4,260 | $225,300 | $53,500 | $171,800 |
| 2017 | $4,029 | $209,600 | $53,500 | $156,100 |
| 2016 | $4,056 | $196,800 | $44,200 | $152,600 |
| 2015 | $3,950 | $196,800 | $44,200 | $152,600 |
| 2014 | $3,845 | $196,800 | $44,200 | $152,600 |
Source: Public Records
Map
Nearby Homes
- 9 Ansonia Rd Unit 9A
- 2 Natural History Dr
- 7 Eaglehead Terrace Unit 3
- 64 Wauwinet Rd
- 5 Fyrbeck Ave
- 476 Plantation St
- 91-93 Natural History Dr
- 200 N Quinsigamond Ave
- 6 Crane Cir
- 59 Olympia Ave Unit 4
- 65 Lake Ave Unit 1008
- 8 Shrewsbury Green Dr Unit G
- 68 Shrewsbury Green Dr Unit J
- 77 -79 Harrington Ave
- 44 Shrewsbury Green Dr Unit B
- 68 S Quinsigamond Ave Unit 4
- 135 Lake Ave
- 7 Wingate St
- 327 Plantation St Unit 312
- 34 Sherbrook Ave
- 101 Lake Ave N
- 2 Winneconnett Rd
- 4 Winneconnett Rd
- 48 Dominion Rd
- 50 Dominion Rd Unit 1
- 50 Dominion Rd
- 50 Dominion Rd Unit 50
- 46A Dominion Rd
- 46B Dominion Rd
- 6 Winneconnett Rd
- 6 Winneconnett Rd Unit 6
- 42 Dominion Rd
- 44 Dominion Rd
- 8 Winneconnett Rd
- 1 Winneconnett Rd
- 3 Winneconnett Rd
- 10 Winneconnett Rd
- 192 Dominion Rd
- 5 Winneconnett Rd
- 189 Dominion Rd
Your Personal Tour Guide
Ask me questions while you tour the home.