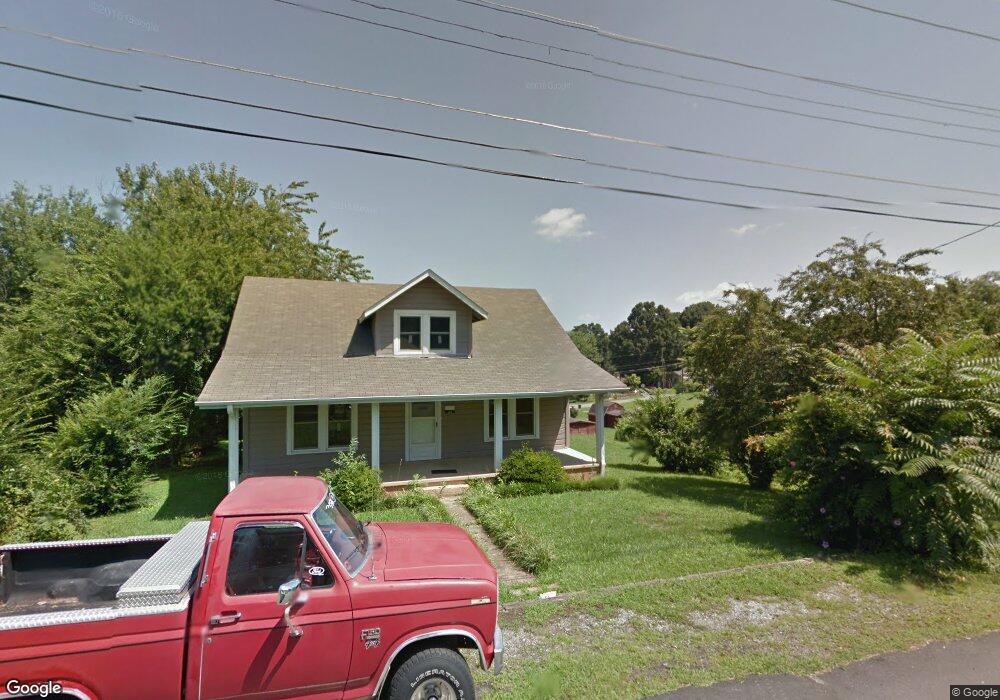
99 Leach St Unit 7 Marion, NC 28752
Estimated Value: $185,000 - $259,000
4
Beds
1
Bath
1,632
Sq Ft
$142/Sq Ft
Est. Value
About This Home
This home is located at 99 Leach St Unit 7, Marion, NC 28752 and is currently estimated at $232,347, approximately $142 per square foot. 99 Leach St Unit 7 is a home located in McDowell County with nearby schools including Marion Elementary School, East McDowell Junior High School, and McDowell High School.
Ownership History
Date
Name
Owned For
Owner Type
Purchase Details
Closed on
Feb 23, 2024
Sold by
Price Melissa Randolph and Price Robbie Dwayne
Bought by
Shook Spencer Brenning and Shook Irely
Current Estimated Value
Home Financials for this Owner
Home Financials are based on the most recent Mortgage that was taken out on this home.
Original Mortgage
$212,135
Outstanding Balance
$206,150
Interest Rate
4%
Mortgage Type
VA
Estimated Equity
$26,197
Purchase Details
Closed on
Jul 22, 2016
Sold by
Washburn Judy B and Washburn Joseph Daniel
Bought by
Randolph Melissa Ann
Home Financials for this Owner
Home Financials are based on the most recent Mortgage that was taken out on this home.
Original Mortgage
$94,900
Interest Rate
4.25%
Mortgage Type
Adjustable Rate Mortgage/ARM
Purchase Details
Closed on
Jan 1, 1947
Bought by
Burgin Ellen and Washburn Judith B
Create a Home Valuation Report for This Property
The Home Valuation Report is an in-depth analysis detailing your home's value as well as a comparison with similar homes in the area
Home Values in the Area
Average Home Value in this Area
Purchase History
| Date | Buyer | Sale Price | Title Company |
|---|---|---|---|
| Shook Spencer Brenning | $220,000 | None Listed On Document | |
| Randolph Melissa Ann | $95,000 | None Available | |
| Burgin Ellen | -- | -- |
Source: Public Records
Mortgage History
| Date | Status | Borrower | Loan Amount |
|---|---|---|---|
| Open | Shook Spencer Brenning | $212,135 | |
| Previous Owner | Randolph Melissa Ann | $94,900 |
Source: Public Records
Tax History Compared to Growth
Tax History
| Year | Tax Paid | Tax Assessment Tax Assessment Total Assessment is a certain percentage of the fair market value that is determined by local assessors to be the total taxable value of land and additions on the property. | Land | Improvement |
|---|---|---|---|---|
| 2025 | $1,395 | $233,360 | $25,000 | $208,360 |
| 2024 | $603 | $100,810 | $25,000 | $75,810 |
| 2023 | $603 | $100,810 | $25,000 | $75,810 |
| 2022 | $434 | $71,380 | $15,000 | $56,380 |
| 2021 | $434 | $71,380 | $15,000 | $56,380 |
| 2020 | $441 | $71,380 | $0 | $0 |
| 2019 | $441 | $61,470 | $0 | $0 |
| 2017 | $371 | $63,920 | $0 | $0 |
| 2016 | $394 | $61,470 | $12,000 | $49,470 |
| 2014 | $194 | $61,470 | $12,000 | $49,470 |
| 2013 | -- | $61,470 | $12,000 | $49,470 |
Source: Public Records
Map
Nearby Homes
- 200 Woodland Dr
- 27 Forest Park Rd
- 610 Miller Ave
- 17 3rd St
- 61 3rd St Unit 98
- 129 Seagle St
- 60 3rd St
- 60 Atwood Dr
- 70 3rd St Unit 87
- 329 Morehead Rd
- 87 2nd St
- 175 Kathy St
- 645 Tunnel Rd Unit 157 & 158
- 387 Highway 70 E
- 118 4th C St Unit 79
- 595 E Court St
- 146 4th C St Unit 77
- 135 6th C St Unit 31
- 41 Miller Ave
- 70 Alabama Ave