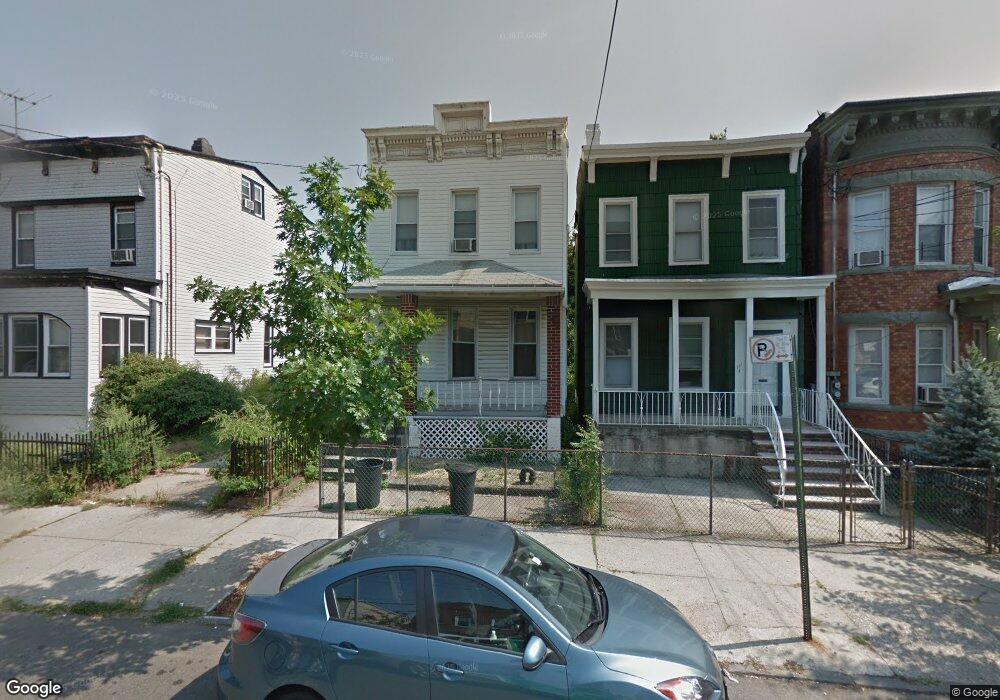
99 Linwood St Brooklyn, NY 11208
Cypress Hills NeighborhoodEstimated Value: $709,139 - $936,000
--
Bed
--
Bath
1,344
Sq Ft
$632/Sq Ft
Est. Value
About This Home
This home is located at 99 Linwood St, Brooklyn, NY 11208 and is currently estimated at $849,035, approximately $631 per square foot. 99 Linwood St is a home located in Kings County with nearby schools including P.S. 108 - Sal Abbracciamento, Liberty Avenue Middle School, and Vista Academy.
Ownership History
Date
Name
Owned For
Owner Type
Purchase Details
Closed on
Oct 23, 2003
Sold by
Fox Suan H
Bought by
Fox Susan H
Current Estimated Value
Home Financials for this Owner
Home Financials are based on the most recent Mortgage that was taken out on this home.
Original Mortgage
$245,000
Outstanding Balance
$109,921
Interest Rate
5.65%
Mortgage Type
Purchase Money Mortgage
Estimated Equity
$739,114
Purchase Details
Closed on
Dec 8, 1998
Sold by
Hud
Bought by
Fox Susan H
Home Financials for this Owner
Home Financials are based on the most recent Mortgage that was taken out on this home.
Original Mortgage
$108,000
Interest Rate
6.9%
Mortgage Type
FHA
Purchase Details
Closed on
Jun 28, 1995
Sold by
Metmor Financial Inc
Bought by
Hud
Create a Home Valuation Report for This Property
The Home Valuation Report is an in-depth analysis detailing your home's value as well as a comparison with similar homes in the area
Home Values in the Area
Average Home Value in this Area
Purchase History
| Date | Buyer | Sale Price | Title Company |
|---|---|---|---|
| Fox Susan H | -- | -- | |
| Fox Susan H | $48,000 | -- | |
| Hud | -- | -- |
Source: Public Records
Mortgage History
| Date | Status | Borrower | Loan Amount |
|---|---|---|---|
| Open | Fox Susan H | $245,000 | |
| Previous Owner | Fox Susan H | $108,000 | |
| Closed | Fox Susan H | $70,000 |
Source: Public Records
Tax History Compared to Growth
Tax History
| Year | Tax Paid | Tax Assessment Tax Assessment Total Assessment is a certain percentage of the fair market value that is determined by local assessors to be the total taxable value of land and additions on the property. | Land | Improvement |
|---|---|---|---|---|
| 2025 | $4,727 | $43,140 | $15,000 | $28,140 |
| 2024 | $4,727 | $34,080 | $15,000 | $19,080 |
| 2023 | $4,518 | $41,820 | $15,000 | $26,820 |
| 2022 | $4,362 | $41,280 | $15,000 | $26,280 |
| 2021 | $4,333 | $31,860 | $15,000 | $16,860 |
| 2020 | $2,026 | $26,640 | $15,000 | $11,640 |
| 2019 | $4,054 | $21,180 | $15,000 | $6,180 |
| 2018 | $3,719 | $19,704 | $12,315 | $7,389 |
| 2017 | $3,656 | $19,407 | $10,045 | $9,362 |
| 2016 | $3,355 | $18,331 | $10,050 | $8,281 |
| 2015 | $1,988 | $17,317 | $10,557 | $6,760 |
| 2014 | $1,988 | $17,317 | $12,218 | $5,099 |
Source: Public Records
Map
Nearby Homes
- 33 Essex St
- 54 Elton St
- 36 Hale Ave
- 120 Highland Place
- 117 Cleveland St
- 432 Jamaica Ave
- 120 Essex St
- 133 Highland Place
- 80 Etna St
- 68 Norwood Ave
- 42 Norwood Ave
- 324 Arlington Ave
- 147 Essex St
- 0 Force Tube Ave
- 255 Ridgewood Ave
- 33 Jerome St
- 196 Shepherd Ave
- 203 Essex St
- 171 Arlington Ave
- 168 Warwick St