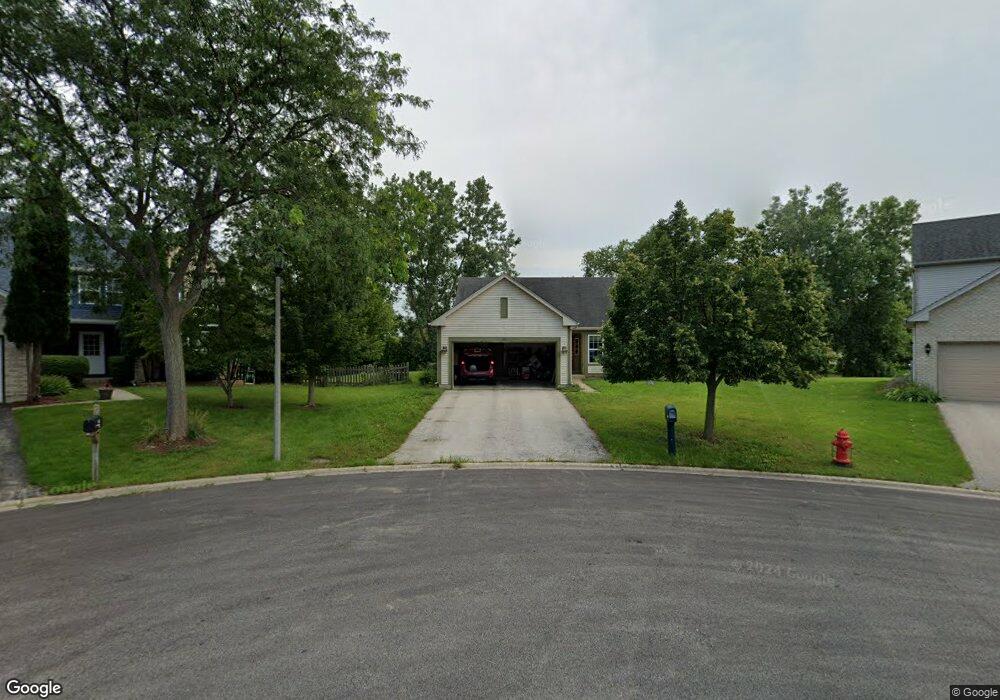
99 Littleton Ct Hainesville, IL 60030
Estimated Value: $343,000 - $356,976
3
Beds
2
Baths
1,400
Sq Ft
$251/Sq Ft
Est. Value
About This Home
This home is located at 99 Littleton Ct, Hainesville, IL 60030 and is currently estimated at $350,744, approximately $250 per square foot. 99 Littleton Ct is a home located in Lake County with nearby schools including Prairieview School, Frederick School, and Grayslake Middle School.
Ownership History
Date
Name
Owned For
Owner Type
Purchase Details
Closed on
Feb 19, 2010
Sold by
Jester Carl E
Bought by
Jester Carl E and Jester Julie
Current Estimated Value
Purchase Details
Closed on
Feb 25, 2008
Sold by
Rapp Andrea
Bought by
Jester Carl E
Home Financials for this Owner
Home Financials are based on the most recent Mortgage that was taken out on this home.
Original Mortgage
$230,405
Outstanding Balance
$143,616
Interest Rate
5.75%
Mortgage Type
FHA
Estimated Equity
$207,128
Purchase Details
Closed on
Jul 28, 1999
Sold by
U S Shelter Group Inc
Bought by
Rapp Andrea
Home Financials for this Owner
Home Financials are based on the most recent Mortgage that was taken out on this home.
Original Mortgage
$115,990
Interest Rate
7.68%
Create a Home Valuation Report for This Property
The Home Valuation Report is an in-depth analysis detailing your home's value as well as a comparison with similar homes in the area
Home Values in the Area
Average Home Value in this Area
Purchase History
| Date | Buyer | Sale Price | Title Company |
|---|---|---|---|
| Jester Carl E | -- | None Available | |
| Jester Carl E | $237,500 | Attorneys Title Guaranty Fun | |
| Rapp Andrea | $182,500 | -- |
Source: Public Records
Mortgage History
| Date | Status | Borrower | Loan Amount |
|---|---|---|---|
| Open | Jester Carl E | $230,405 | |
| Previous Owner | Rapp Andrea | $115,990 |
Source: Public Records
Tax History Compared to Growth
Tax History
| Year | Tax Paid | Tax Assessment Tax Assessment Total Assessment is a certain percentage of the fair market value that is determined by local assessors to be the total taxable value of land and additions on the property. | Land | Improvement |
|---|---|---|---|---|
| 2024 | $8,525 | $86,975 | $18,628 | $68,347 |
| 2023 | $7,647 | $79,823 | $17,096 | $62,727 |
| 2022 | $7,647 | $69,115 | $13,256 | $55,859 |
| 2021 | $7,568 | $66,431 | $12,741 | $53,690 |
| 2020 | $8,084 | $67,201 | $12,123 | $55,078 |
| 2019 | $7,811 | $64,474 | $11,631 | $52,843 |
| 2018 | $7,906 | $65,083 | $17,523 | $47,560 |
| 2017 | $7,830 | $61,220 | $16,483 | $44,737 |
| 2016 | $7,489 | $56,513 | $15,216 | $41,297 |
| 2015 | $7,273 | $51,629 | $13,901 | $37,728 |
| 2014 | $8,135 | $56,458 | $14,300 | $42,158 |
| 2012 | $8,072 | $58,964 | $14,935 | $44,029 |
Source: Public Records
Map
Nearby Homes
- 375 N Tower Dr Unit 1202
- 4 W Tall Oak Dr
- 448 N Patriot Dr Unit 705
- 372 White Tail Dr
- 582 Holiday Ln Unit 472
- 230 N Alleghany Rd
- 26155 W Il Route 120
- 565 Jeffrey Ave
- 159 E Elk Ct
- 113 E Big Horn Dr
- 319 Grandview Dr
- 606 N Triumph Ct Unit 236
- 91 W Big Horn Dr Unit 151
- 304 E Willow Dr
- 337 Woodland Dr Unit 6
- 34110 S Circle Dr
- 121 Highmoor Dr
- 353 Getchell Ave
- 123 E Pineview Dr
- 220 Bluff Ct
- 101 Littleton Ct
- 100 Littleton Ct
- 108 Littleton Ct
- 109 Littleton Ct
- 84 Misty Hill Ln
- 74 Misty Hill Ln
- 115 Heritage Trail
- 102 Misty Hill Ln
- 83 Heritage Trail
- 85 Stillwater Dr
- 66 Misty Hill Ln
- 93 Heritage Trail
- 129 Heritage Trail
- 107 Stillwater Dr
- 110 Misty Hill Ln
- 56 Misty Hill Ln
- 73 Heritage Trail
- 63 Heritage Trail
- 118 Misty Hill Ln
- 48 Stillwater Dr