Estimated Value: $143,000 - $163,185
3
Beds
1
Bath
912
Sq Ft
$166/Sq Ft
Est. Value
About This Home
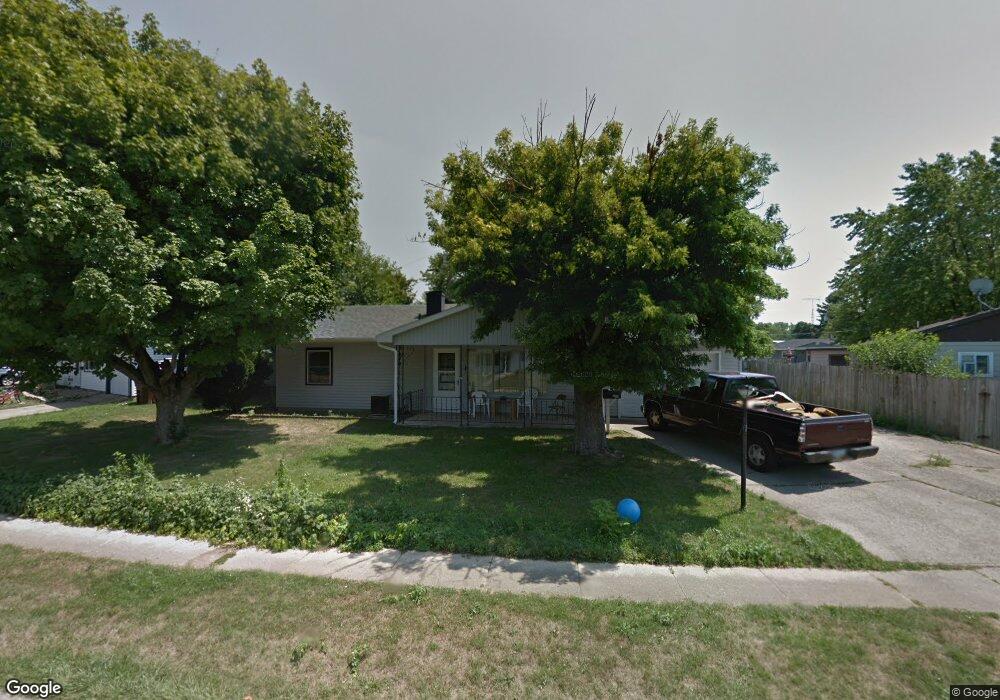
This home is located at 99 Lowell Rd, Xenia, OH 45385 and is currently estimated at $151,546, approximately $166 per square foot. 99 Lowell Rd is a home located in Greene County with nearby schools including Xenia High School, Summit Academy Community School for Alternative Learners - Xenia, and Legacy Christian Academy.
Ownership History
Date
Name
Owned For
Owner Type
Purchase Details
Closed on
Apr 24, 2024
Sold by
Jordan Brooke C
Bought by
Villinger Brooke C
Current Estimated Value
Purchase Details
Closed on
Jul 26, 2019
Sold by
Abel Diane E and Noval Diane E
Bought by
Jordan Brooke C
Home Financials for this Owner
Home Financials are based on the most recent Mortgage that was taken out on this home.
Original Mortgage
$76,587
Interest Rate
5.12%
Mortgage Type
FHA
Purchase Details
Closed on
Dec 21, 2000
Sold by
Noval Diane E and Noval Diane E
Bought by
Abel William J and Abel Diane E
Home Financials for this Owner
Home Financials are based on the most recent Mortgage that was taken out on this home.
Original Mortgage
$67,990
Interest Rate
7.8%
Mortgage Type
FHA
Purchase Details
Closed on
Dec 19, 2000
Sold by
Noval Arthur M
Bought by
Noval Diane E and Abel Diane E
Home Financials for this Owner
Home Financials are based on the most recent Mortgage that was taken out on this home.
Original Mortgage
$67,990
Interest Rate
7.8%
Mortgage Type
FHA
Purchase Details
Closed on
Jun 1, 1986
Bought by
Abel Diane E
Create a Home Valuation Report for This Property
The Home Valuation Report is an in-depth analysis detailing your home's value as well as a comparison with similar homes in the area
Home Values in the Area
Average Home Value in this Area
Purchase History
| Date | Buyer | Sale Price | Title Company |
|---|---|---|---|
| Villinger Brooke C | -- | None Listed On Document | |
| Jordan Brooke C | $78,000 | None Available | |
| Abel William J | -- | -- | |
| Noval Diane E | -- | -- | |
| Abel Diane E | $40,900 | -- |
Source: Public Records
Mortgage History
| Date | Status | Borrower | Loan Amount |
|---|---|---|---|
| Previous Owner | Jordan Brooke C | $76,587 | |
| Previous Owner | Abel William J | $67,990 |
Source: Public Records
Tax History Compared to Growth
Tax History
| Year | Tax Paid | Tax Assessment Tax Assessment Total Assessment is a certain percentage of the fair market value that is determined by local assessors to be the total taxable value of land and additions on the property. | Land | Improvement |
|---|---|---|---|---|
| 2024 | $1,699 | $39,700 | $8,450 | $31,250 |
| 2023 | $1,699 | $39,700 | $8,450 | $31,250 |
| 2022 | $1,389 | $27,690 | $6,030 | $21,660 |
| 2021 | $1,408 | $27,690 | $6,030 | $21,660 |
| 2020 | $1,349 | $27,690 | $6,030 | $21,660 |
| 2019 | $1,249 | $24,140 | $4,400 | $19,740 |
| 2018 | $1,254 | $24,140 | $4,400 | $19,740 |
| 2017 | $1,164 | $24,140 | $4,400 | $19,740 |
| 2016 | $1,164 | $22,590 | $4,400 | $18,190 |
| 2015 | $1,167 | $22,590 | $4,400 | $18,190 |
| 2014 | $1,117 | $22,590 | $4,400 | $18,190 |
Source: Public Records
Map
Nearby Homes
- 1391 June Dr
- 1283 June Dr
- 1233 June Dr
- 1223 June Dr
- 1342 Kylemore Dr
- 1351 Omard Dr
- 343 Sheelin Rd
- 121 S Progress Dr
- 1144 Rockwell Dr
- 912 Omard Dr
- 883 Omard Dr
- 1568 Cheyenne Dr
- 509 Antrim Rd
- 1618 Navajo Dr
- 1208 Bellbrook Ave
- 305-325 Bellbrook Ave
- 1272 Bellbrook Ave
- 1653 Seneca Dr
- 2758 Wyoming Dr
- 453 Walnut St